Streamable Playlists with User Data
Daniel Boland
The SPUD dataset contains 10,000 playlists created by Last.fm users. Spotify URI and song metadata are included for every song. Full listening history is also included for a number of users. The dataset is in SQLite database format and is available under the MIT open source license:
Download dataset
Read the paper
Analysing User Listening History
This example shows a user’s listening behaviour over several years. The entropy over features is computed for a moving window of track plays, indicating how diverse the listening was over each feature. Taking artist IDs as example, throughout 2007-2010, the entropy is often low, with some sessions of just one artist. In February 2010, the user began using online radio, listening to tracks irrespective of artist, causing a distinct change in entropy. Note that they still sometimes continued their old style of music retrieval as well.
Example code
library(RSQLite)
library(infotheo)
library(reshape)
library(ggplot2)
library(changepoint)
library(zoo)
library(RColorBrewer)

# Query the dataset
con <- dbConnect(SQLite(), "spud.sqlite")
history <- dbGetQuery(con, "SELECT tl.date, t.* FROM lastfmtracklistens as tl JOIN tracks as t ON tl.track=t.trackid WHERE tl.user=2275;")

# Sort listens by date
history <- history[with(history, order(date)),]

# We need discrete features for entropy functions
history[,'popularity'] <- discretize(history[,'popularity'],nbins=25)
history[,'duration'] <- discretize(history[,'duration'],nbins=25)

# Select a feature
f <- zoo(history$artist)
time(f) <- as.POSIXlt(history$date)

# Calculate the windowed entropy
H <- rollapply(f, 20, entropy, by=20, partial=TRUE)
Hdf <- fortify(H)

# Find a changepoint
cp <- Hdf[attributes(cpt.meanvar(Hdf$H))$cpts[1],]$Index
Hdf$aftercp <- Hdf$Index > cp
historyPlot <- ggplot(data=Hdf, aes(x=Index, y=H)) + geom_point(alpha=0.7, aes(colour=aftercp)) + ...
Playlist-based Feature Selection
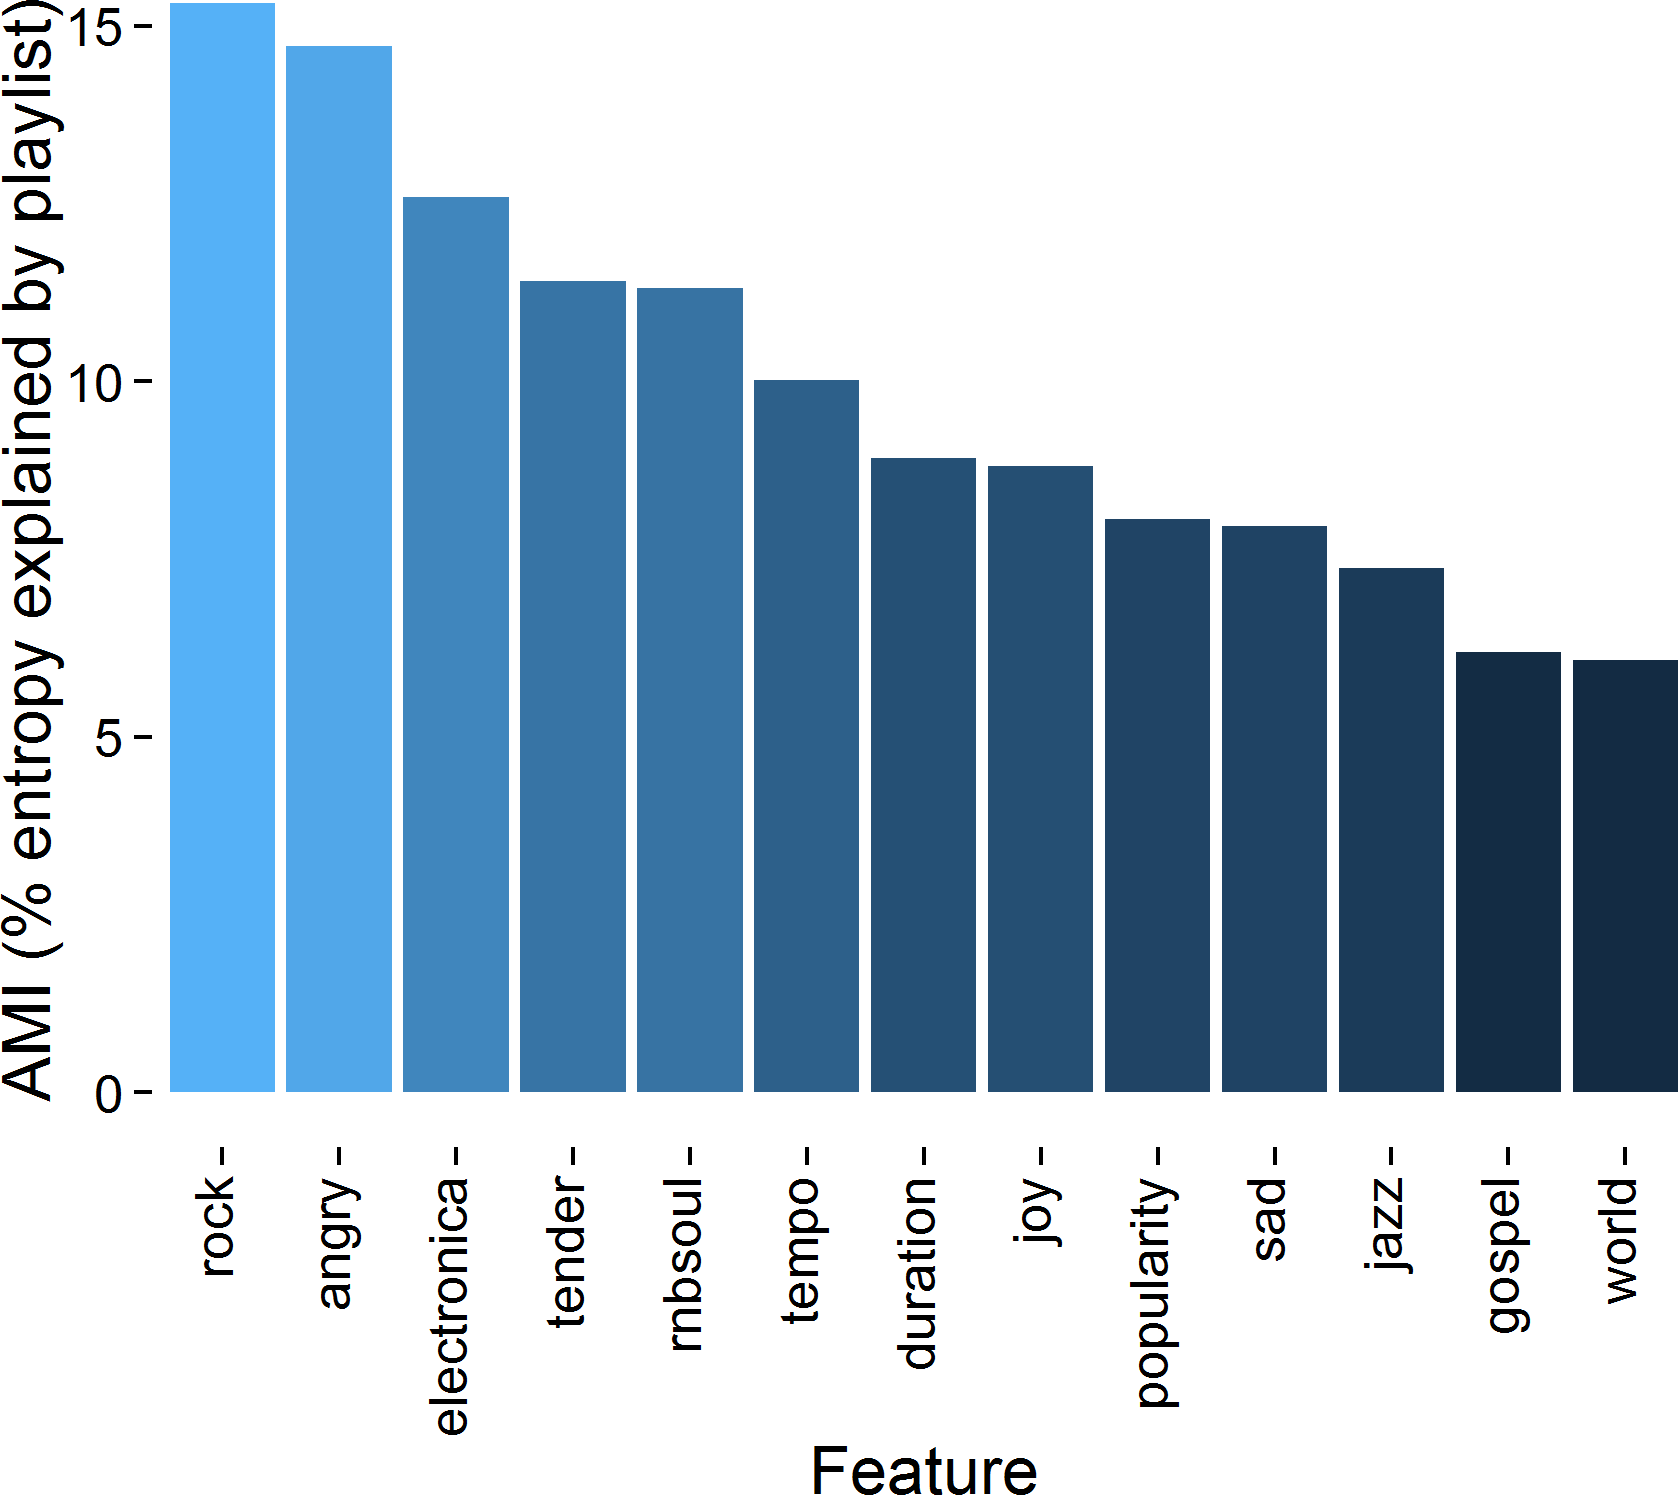
This example shows how to identify music features relevant to how users made the 10,000 playlists in the dataset. We retrieved music features for each song and calculate the Mutual-Information of music features with playlist membership.
Example code
library(infotheo)
library(RSQLite)
library(ggplot2)

# Calculate Adapted Mutual Information
# We normalise against feature entropy only, and not class (playlist)
# Refer to the paper for more details
getAMI <- function(feature, class) {
  I <- mutinformation(class, feature)
  n0 <- mutinformation(class[sample.int(length(class))], feature)
  #return((I - n0) / (max(entropy(class), entropy(feature)) - n0))
  return((I - n0) / (entropy(feature) - n0))
}

# Query the dataset
con <- dbConnect(SQLite(), "spud.sqlite")
# Our entropy view joins playlists with music features
# These are propriertary and not currently included in the SPUD dataset
data <- dbGetQuery(con, "SELECT * FROM [Entropy];")

# Select the features we're interested in
features <- data[,6:(ncol(data)-4)]
class <- data$playlist

# Calculate AMI between features and class
fami <- apply(features,2,getAMI,class)