Improving the Presentation of Accident Reports over the World Wide Web
C.W. Johnson; Department of Computing Science; University of Glasgow; Scotland.
http://www.dcs.gla.ac.uk/~johnson
Keywords: accident analysis; visualisation; accident reports.
Abstract
Most accident investigation agencies now place their reports on the World Wide Web. This is a relatively cheap and effective means of disseminating information to companies and regulators. However, we recently conducted an international survey to assess these web sites; see
(Ref. 1). The results were disappointing. Most readers found that web-based accident reports were poorly structured. One reason for this negative reaction is that many investigation agencies simply translate paper-based reports into HyperText Mark-up Language (HTML) or Adobe’s proprietary Portable Document Format (PDF). There have been few attempts to exploit the novel presentation facilities offered by today’s communications networks. This paper, therefore, presents a range of visualisation techniques that can be used to effectively present accident and incident reports over the World Wide Web. These techniques include the use of imagemaps and of desktop virtual reality applications, such as VRML, QuicktimeVR and Java3D. The intention is to identify approaches that can effectively disseminate information about accidents and incidents to engineers, operators and regulators.Introduction
Accident and incident reports are the primary means of ensuring future safety in many industries. It is, therefore, surprising that so little attention has been paid to the format and presentation of these documents. As a result, many accident reports are very poorly written. Some contain factual errors and omissions. Others contain contradictory arguments about the causes of an accident (Refs. 2 and 3). These issues need not be as serious as they might appear. For example, it is not always possible to identify all of the possible causes of an accident. However, the readers of many accident reports cannot distinguish these instances of necessary ambiguity and doubt from omissions that are caused by carelessness.
Over the decade, we have developed a range of techniques that can be used to identify and resolve the weaknesses in accident reports (Refs 2 and 3). For example, we have built mathematical models and simulations to show that an accident could not have developed in the manner described by several major reports. We have also adapted these techniques to point out the discrepancies between official accounts and those prepared, for instance, by the companies involved in an accident. More recently, we have begun to focus on means of improving the presentation of accident reports over the World Wide Web.
The Limitations of Existing Approaches
Two principal approaches can be identified in the presentation of accident reports over the web. The first simply converts text documents into HTML, the second relies upon the proprietary PDF format to preserve the look and feel of the printed version.
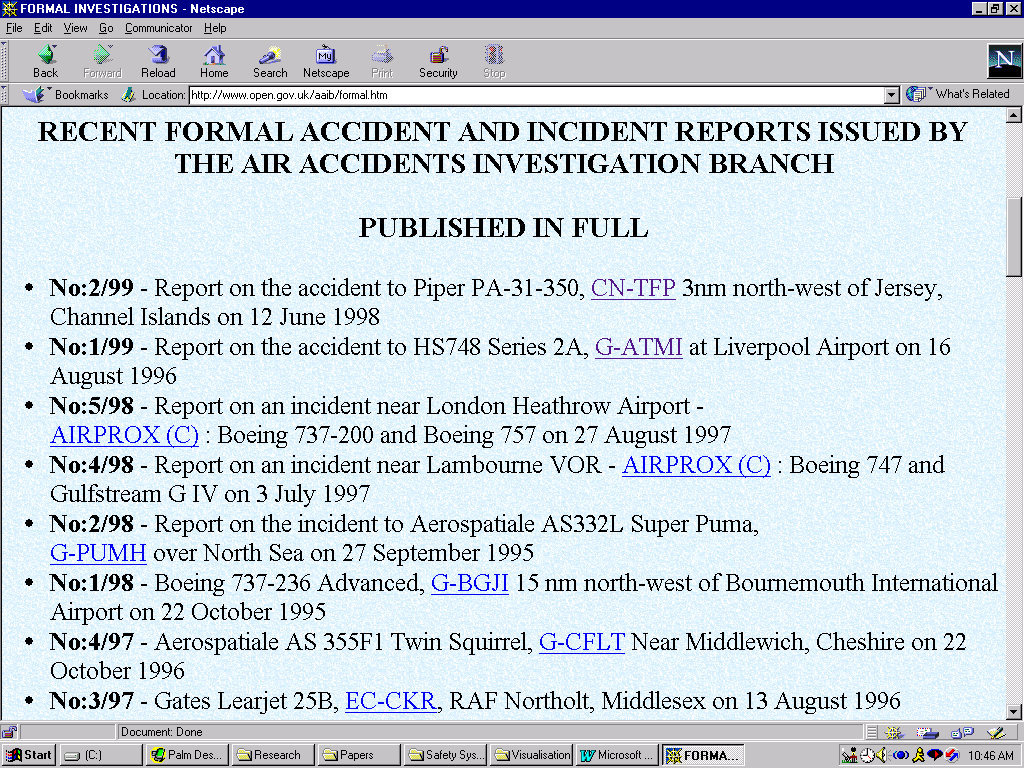
The HTML Approach; This is illustrated by the UK Air Accident Investigation Branch’s formal investigation page:
http://www.open.gov.uk/aaib/formal.htm.The user is presented with a series of hyperlinks that refer to a number of different accident reports. The links are listed in chronological order of submission. This mirrors the classification scheme that was used to classify paper-based AAIB reports. However, it also makes it difficult for readers to identify common trends and themes between accidents with similar causes but which may have occurred over a period of time. Figure 1 illustrates this approach.
Figure 1 – AAIB Formal Accident Reports
(Hint: click on this image and see more detail).
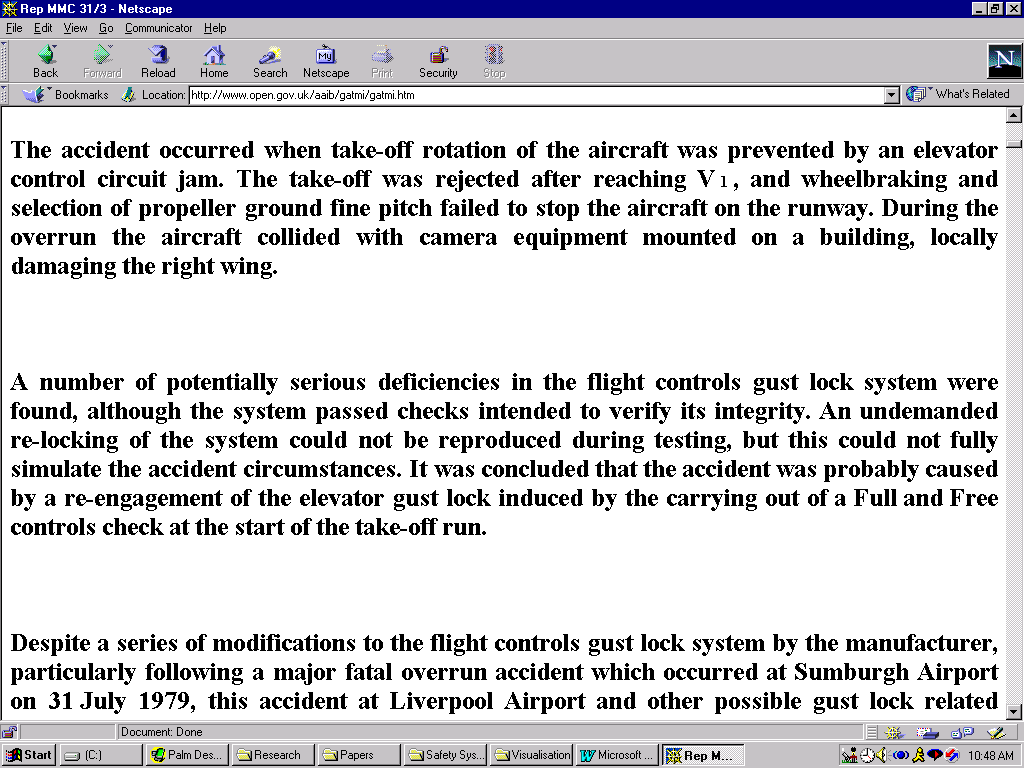
Figure 2 – HTML Format of an Accident Report
(Hint: click on this image and see more detail).
Once the user selects a particular report, they can read it in HTML format. This offers a number of benefits. Firstly, no special applications or viewers are needed to access documents in this format. This minimises the reader’s effort in obtaining the report. Secondly, browsers are optimised to display documents using this mark-up language. Download latencies are minimised. Thirdly, the introduction of hyperlinks and on-line keyword search facilities can ease the navigation problems that often frustrate the readers of paper-based documents. Figure 2 illustrates an HTML version of an AAIB report into an accident that involved an aircraft overrun on takeoff;
http://www.open.gov.uk/aaib/gatmi/gatmi.htmThis approach does, however, suffer from a number of limitations. There are perceptual and cognitive problems associated with the on-screen reading of technical documents. This explains the subjective difficulties that reader’s report when using large HTML documents. These problems are compounded by the difficulty of obtaining printed versions of the accident reports. HTML tags work well when they are interpreted and displayed by current web browsers. They do not work well when the same browsers are used to obtain printed output from HTML documents. Figures and photographs are often embedded as hypertext links. These will be missing in the printed version. Readers must manually piece together their hardcopy. Fortunately, many of these limitations are avoided by agencies that use Adobe’s proprietary PDF approach.
The Adobe PDF approach; The agencies that use PDF, typically, also exploit the AAIB’s technique of listing on-line reports. The NTSB’s publication page illustrates this:
http://www.ntsb.gov/Publictn/Pub_list.htmThis separates the reports into lists that reflect a particular focus for the NTSB’s activities. Pipeline investigations are separated from railroad reports. Highway accidents are kept separate from marine accidents. The NTSB’s special report series does, however, provide an overview of common causal factors within each of these functional groupings. For example, they draw upon several different incidents to provide information about safety at level crossings. Sadly, none of the existing special reports provide electronic links to the individual reports that are listed on the same page.
Adobe’s PDF format provides a number of benefits. In particular, freely available readers can be used to view the files in a way that emulates the printed document. Figure 3 illustrates the approach. This shows a PDF report into a collision between an AMTRAK train and a Maryland Commuter service. The page integrates photographs and text. It places them in the same position and dimension on the screen as it would if the document were printed.
A further benefit of PDF is that reports can easily be printed. This reduces the psychological and physiological problems of on-screen reading. However, these important benefits must be balanced against a number of notable problems. Firstly, it can be difficult for people to obtain and correctly install PDF readers. This is important because these programmes are, typically, not a standard part of most browsers. Although PDF files are compressed, users can also experience significant delays in accessing these documents compared to HTML reports. Finally, it can be difficult to extract information once it has been encoded within a PDF document. This is a significant barrier if readers want to compile their own digest of related incidents within an industry.
Criticism of Existing Approaches; Regulatory authorities have focussed upon the DISSEMINATION of accident reports over the web. Few, if any, have considered the opportunities that this medium provides for the effective PRESENTATION of these documents. This is ironic given the emphasis that is increasingly being placing upon the human precursors to major failures.
This apparent neglect is depressing because electronic media provide opportunities to improve upon, rather than simply replicate, printed documents. For instance, imagemaps can be used to provide a direct link between textual descriptions and the graphical plans that are often used to illustrate accident reports. This can help readers to navigate complex graphical and textual information in an on-line report. Similarly, desktop virtual reality (desktopVR) techniques provide readers with a far better impression of the context in which an accident occurred.
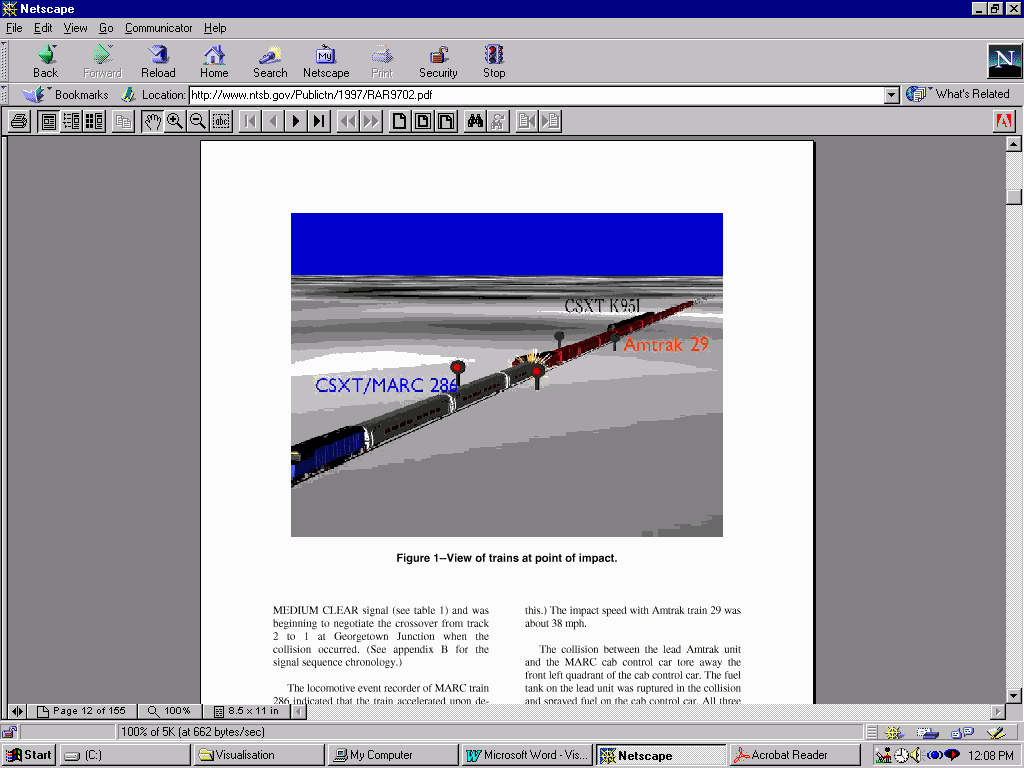
Figure 3 – PDF Presentation of an NTSB Report
(Hint: click on the image and see more detail)
New Techniques for Visualising Locations
Imagemaps provide readers with means of exploring the information that relates to particular locations in an accident. Figure 4 applies this approach to the Sheen report into the Herald of Free Enterprise. The image shown is a sectional diagram of the Herald’s sister ship; the Spirit of Free Enterprise (ref. 4). Users simply select the relevant sections of the image to view passages that relate to the car deck, the bridge and so on. The intention is that readers of an accident report can familiarise themselves with critical areas of the vessel that are described in the report.
As readers navigate into more detailed regions of the ship, such as the Bridge, they can then extract information about the events that occurred at particular times in that location. This more detailed use of our imagmap techniques is illustrated in Figure 5. Ultimately, this would lead the reader to hypertext links that lead back to the full text version of the accident report.
Imagemaps provide readers with a means of moving between the textual and graphical information in an accident report. They help to provide an overview of the location in which an accident occurred. The benefits of this approach can be significantly enhanced by desktopVR techniques, such as QuicktimeVR. This approach involves shooting a large number of photographs. A viewer is then used to 'stitch' the images together so that users can pan around or zoom into a 3D scene. The photographs are taken using a motorised tripod and a digital camera so that large buildings and complex scenes can be recorded in a relatively short period of time.
The visualisation facilities supported by QuicktimeVR have recently been extended to support more complex forms of interaction through the introduction of embedded hyperlinks to other resources, such as textual accounts and eye witness statements. An important benefit of this approach, over other forms of VR that have been used in accident reconstruction, is that QuicktimeVR applications run on standard, desktop PCs. They are also photo-realistic.
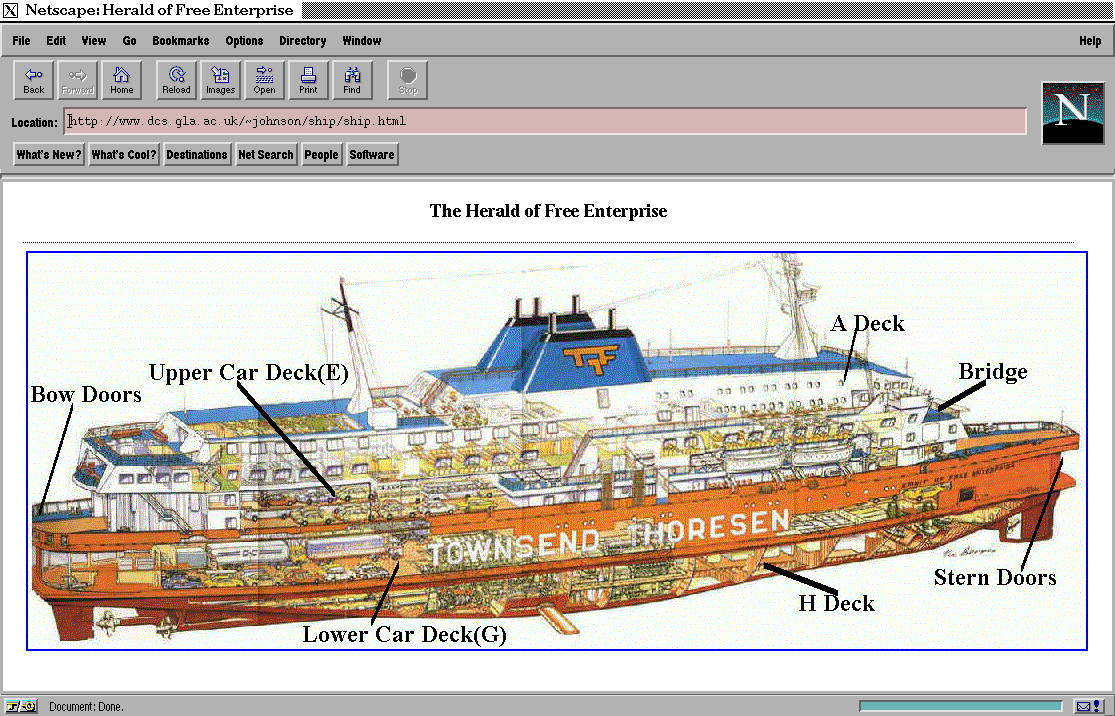
Figure 4 – Imagemap for part of Sheen Report
(Hint: click on this image and see the imagemap.)

Figure 5 – Imagemap Detail of Sheen Report
(Hint: click on this image and see more detail.)
Figure 6 provides screen-shots from a QuicktimeVR tour of a 757 cockpit. The user simply moves the mouse through 360 degrees to alter their perspective on the scene. The software then automatically interpolates between images to give the user the impression that they are moving inside a three-dimensional space. Such techniques have important benefits for any report that has to convey the location in which an accident took place. For instance, Figure 6 can be used to illustrate the line of sight properties that affect flight-crew co-operation.
Visualising Components
We have used an extension of the presentation techniques in figure 7 to provide information about process components. This is useful if particular sub-assemblies have failed or if the reader has to follow detailed information about maintenance tasks. The following series of stills illustrate this use of QuicktimeVR applied to Lucas cutters. These are used by the fire-brigae to free trapped motorists from their vehicles. We are also starting a project to provide three-dimensional views of aircraft engines during various maintenance tasks. The programs allow engineers to rotate the images along any axis and to zoom in and out of the components to get a more detailed view of the object. The intention is to provide a far better impression of maintenance problems than might otherwise be provided through either paper-based documents or hypertext accounts.
These three-dimensional presentations not only support web-based accident reports. They can also be used during the litigation that follows from many accidents. Interactive, photo-realistic environments can help jurors familiarise themselves with what are often highly complex and hazardous environments.
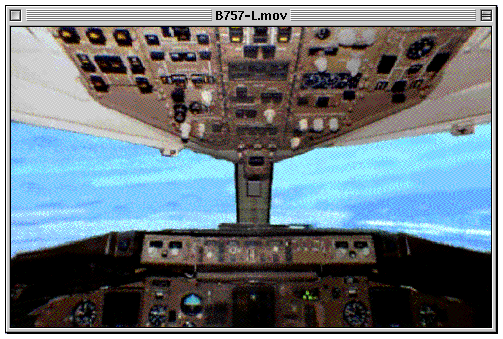
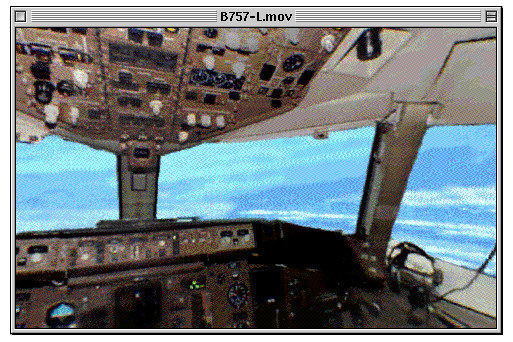
Figure 6 – QuicktimeVR Images of a 757 (You will need the Quicktime plug-in to view this file).
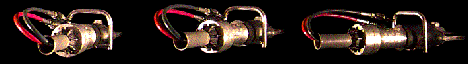
Figure 7 – QuicktimeVR of a Lucas Cutter(You will need the Quicktime plug-in to view this file).
Visualising Dynamic Information
The previous techniques help users to view location dependent information. They do not help people to understand how the course of an accident changed over time. We have, therefore, developed a range of 3D Timelines to provide this information. These use desktop virtual reality techniques similar to those mentioned above, in this case Virtual Reality Mark-up Language (VRML) instead of QuicktimeVR. VRML is a platform independent language for composing 3D models from cones, spheres and cubes. These primitives are combined to create more complex scenes. One of the reasons for the rapid rise in the popularity of this medium is that it provides interface designers with a means of delivering 3D interfaces over the web. With the advent of VRML 2.0 it is possible to generate and animate scenes that contain links to a wide variety of other information sources including videos, databases and other web pages.
Figure 8 illustrates the application of VRML to model the events leading to an accident. This picture shows how our 3D Timelines contain markers that indicate the actions and events that occurred at particular moments during an accident. The user can walk along the line to view events from the start of the accident looking forward into the future. They can also look at the events from any other perspective to gain a better view of the things that happened immediately before and after each moment in time. Flags are used to represent the events leading to the accident. If a flag is planted into the line then an exact timing is available. A flag that has not been planted indicates that the exact time is not known.
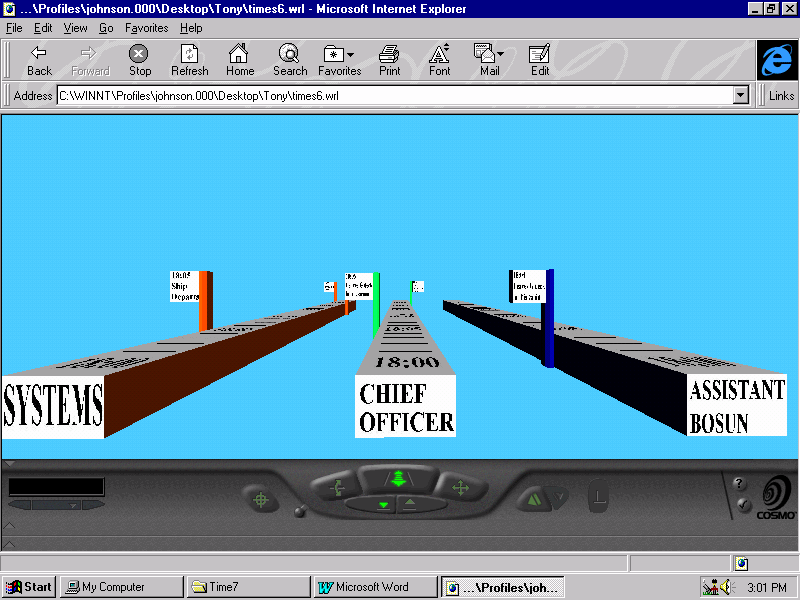
Figure 8 – 3D Timeline of the Sheen Report(You will need a VRML plug-in to view this file)
As before, the intention is not to replace the textual versions of an accident report. Therefore, if the user selects any of the objects shown in Figure 8, their browser will be updated to display the relevant sections of text within the conventional report. This could either be displayed using the standard HTML or PDF techniques that were introduced in previous sections. An important benefit of the approach shown in Figure 8 is that it provides a high-level framework of the events leading to an accident. Just as the imagemaps can be used to familiarise readers with complex spatial information, so these timelines provide an impression of the complex temporal information that characterises many accidents. Such overviews are increasingly important as accident reports grow to reflect the scale and complexity of the systems that they document.
Improving the Quality of Argument
Accident reports are rhetorical documents. They are intended to convince their readers about the probable causes of failure. However, existing documents suffer from a number of weaknesses that cannot easily be resolved through the application of QuicktimeVR or VRML. For instance, there have been inconsistencies both in the treatment of evidence and in the argument that supports particular conclusions (Refs 2 and 3). We have found personnel being placed in two positions at the same time. We have found conclusions that are supported by evidence that has been contradicted within the same report. These concerns led to the development of Conclusion, Analysis, Evidence (CAE) diagrams.
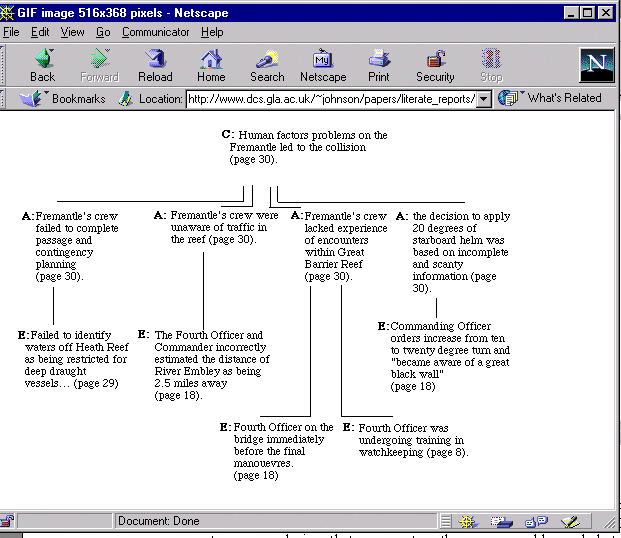
Figure 9 - CAE Diagram of the Fremantle Collision
Figure 9 applies this approach to a case study that was provided by the Australian Maritime Incident Investigation Unit. The top level represents one of the conclusions in the report. The second level indicates the argument or analysis that supports the conclusion. The final level represents the evidence to support or weaken that argument. The MIIU report concluded that the Fremantle's crew made several human errors. These mistakes included their failure to complete adequate contingency and passage planning. This analysis is supported by evidence that the crew failed to identify the waters off Heath Reef as being restricted for deep draught vessels, see page 29 of the report. The human errors also included a lack of awareness about the other traffic on the reef. This is supported by evidence that both the Fourth Officer and the Commander assumed that the River Embley was some 2.5 miles away when they were, in fact, much closer. This evidence is cited on page 18 of the report. The Fremantle's crew also lacked experience of encounters within the Great Barrier Reef. This analysis depends upon two related pieces of evidence. Firstly, that the Fourth office was on the bridge in the lead up to the collision and secondly that this officer was undergoing training in watch keeping. Finally, human factors problems led to the collisions because the decision to apply 20 degrees of starboard helm was based upon incomplete and scanty information. The Commander's surprise at the consequences of his decision, cited on page 18 of the report, provide evidence for this assertion.
It is important to emphasise that the evidence that supports these arguments is split between page 18 in the report, where the Fourth Officer had the bridge at the time of the collision, and page 8, where we are told that they were undergoing training. This illustrates the usability problems that affect conventional accident reports. The reader had to remember that the officer was undergoing training from page 8 to fully understand the implications of evidence on page 18. These limitations also affect both PDF and HTML versions of accident reports where the reader still has to tease out the significant stands of argument from a mass of background detail and rhetoric. CAE diagrams can be used in conjunction with imagemap techniques so that readers can select the rectangles within a CAE diagram to directly view the supporting text in an accident report that lies behind the conclusions, analysis and evidence that is shown in Figure 9.
CAE diagrams help readers to identify the implicit inferential chains that are a common feature of many accident reports. For example, the following CAE diagram shows how evidence on page 18 of the printed report supports a claim on page 30 that the Fremantle's crew was unaware of other traffic on the Reef. This link was never made explicit in the paper or electronic versions of the report.
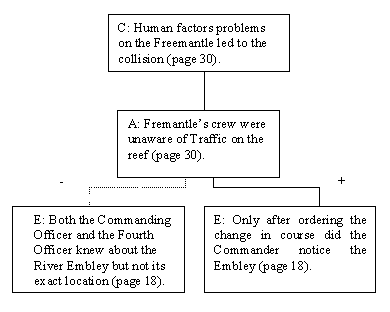
Figure 10: CAE Showing Implicit Arguments.
Not only is it important that accident reports explicitly represent the lines of analysis that support a particular conclusion, it is also important to record any evidence that might contradict such an argument. This is illustrated by the dotted line in Figure 10; there is evidence to suggest that the on-board systems did alert the crew of the Fremantle to the presence of the Embley but that the Fremantle's crew was unsure of its exact position.
CAE diagrams provide an overview of the arguments that both support and weaken particular conclusions. Figure 11 uses a dotted line to show the way in which the Master's argument about the use of the Aldis lamp called into question that of the MIIU investigator. In contrast to the conventional report, the relationship between these two lines of argument is explicitly represented within this diagram.
Limitations and Caveats
This paper has presented a range of visualisation techniques. The initial sections focussed on technological innovation through the application of imagemaps, QuicktimeVR and VRML. Subsequent sections focussed on more theoretical approaches that are intended to help readers visualise the structure of argument within an accident report. Although our focus has been on the end-user of an accident report, it should come as no surprise that many of our techniques have also been developed and deployed to help the teams of investigators who must draft an incident report. They also need to visualise the location of an accident. They also need to reconstruct the events that contribute to a failure. There are, however, several remaining concerns that must be addressed if our techniques are to improve the presentation of accident reports over the world wide web.
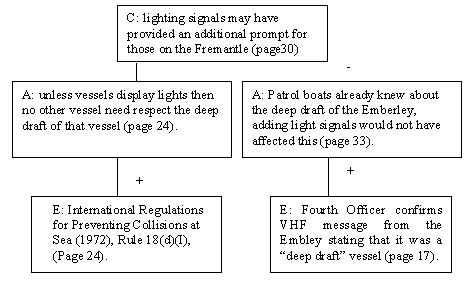
Figure 11:CAE of Alternative Arguments
Cost effectiveness; Accident investigation agencies operate under strict financial limits. New techniques must, therefore, be justified in terms of a detailed cost-benefit analysis. This creates problems because many of our visualisation tools are intended to complement and not replace existing textual reports. In other words, they represent an additional expense over the costs of reproducing the textual reports. However, the existing focus upon dissemination rather than presentation has led to web-based accident reports that are rarely read by either engineers or by the general public. This finding has been backed up by our recent survey work and emphasises the extremely poor cost effectiveness of existing web-based presentations.
Rhetorical impact; Existing reports present arguments about the probable causes of an accident. These arguments frequently depend upon rhetorical effects. For instance, an item of evidence may be repeated several times in the natural language of an accident report. This emphasises its importance in the mind of the investigator and increases its salience for the reader. Similarly, the importance of particular items of information can be stressed by gathering together such "critical facts" into a summary section. These effects introduce bias in many instances. However, they should not be viewed as "a bad thing". They achieve the intended effect of the report; which is to convince the reader of a particular set of conclusions. In contrast, many of the techniques that are presented in this paper introduce new rhetorical techniques. For example, the introduction of a VRML model of an accident can have a profound impact upon many readers. Initial field trials have indicated that people are more willing to believe the version of event shown in a simulation or model than they are in a paper based report. On the one hand this illustrates the importance of these new techniques. Investigation agencies can use them as powerful tools to convince readers about a particular view of an accident. On the other hand, these new techniques may persuade people to accept a simulated version of events that cannot be grounded in the complex evidence that characterises modern accidents.
Conclusion
This paper has argued that investigation authorities have focussed on the dissemination rather than on the presentation of accident reports. As a result, many existing web-based reports are poorly structured and difficult to read using existing web-browsers. This paper has, therefore, argued that imagemaps, VRML models and QuicktimeVR techniques might be used to improve both the quality and structure of these electronic documents. In particular, novel presentation techniques can be used to reconstruct both the location and the flow of events during an accident. They can be used to develop full simulations or provide more abstract graphical overviews.
It is important to stress that this paper is not intended to advocate particular visualisation techniques. The aim is to question whether the current practice of translating paper-based reports into on-line documents is an adequate means of informing designers and operators about the causes of previous failures. It is particularly worrying that several regulatory agencies even ignore their own Health and Safety guidelines about the on-screen presentation of text (poor choice of font, incorrect use of colour etc). Until these more basic requirements are satisfied, there seems little prospect that accident reports will be effectively presented over the world wide web.
Acknowledgements
This work is supported by the UK Engineering and Physical Sciences Research Council, grants GR/JO7686, GR/K69148 and GR/K55040. Thanks are due to Anthony McGill, Bryan Mathers and Pete Snowdon who helped in the development of the desktopVR and imagmap visualisations. I am also grateful to The Motor Ship and V. Berris (FSIAD) who provided the sectional diagram of the Spirit of Free Enterprise shown in Figures 4 and 5. Finally, thanks are due to the members of Strathclyde Regional Fire Brigade who provided help with many of the desktopVR applications illustrated in this paper.
References
Biography
Prof. C.W. Johnson, DPhil, MSc, MA, FBCS, CEng., Dept. of Computing Science, Univ. of Glasgow, Glasgow, G12 8QQ, Scotland. Tel: +44 (141) 330 6053. Fax: +44 (141) 330 4913, e-mail:
johnson@dcs.gla.ac.uk.Chris Johnson leads an accident investigation group that includes human factors experts; software developers and systems engineers. He chairs IFIP Working Group 13.5 on Human Error and Systems Development and has authored over ninety papers on the human contribution to systems failure.