Computers are increasingly being embedded within safety systems. As a result, a number of accidents have been caused by complex interactions between operator 'error' and system 'failure'. Accident reports help to ensure that these 'failures' do not threaten other applications. Unfortunately, a number of usability problems limit the effectiveness of these documents. Each section is, typically, drafted by a different expert; forensic scientists follow metallurgists, human factors experts follow meteorologists. In consequence, it can be difficult for readers to form a coherent account of an accident. This paper argues that fault trees can be used to present a clear and concise overview of major failures. Unfortunately, fault trees have a number of limitations. For instance, they do not represent time. This is significant because temporal properties have a profound impact upon the course of human-computer interaction. Similarly, they do not represent the criticality or severity of a failure. We have, therefore, extended the fault tree notation to represent traces of interaction during major failures. The resulting Accident Fault Tree (AFT) diagrams can be used in conjunction with an official accident report to better visualise the course of an accident. The Clapham Junction railway disaster is used to illustrate our argument.
Keywords: accident analysis; fault trees; operator 'error'; system 'failure'.

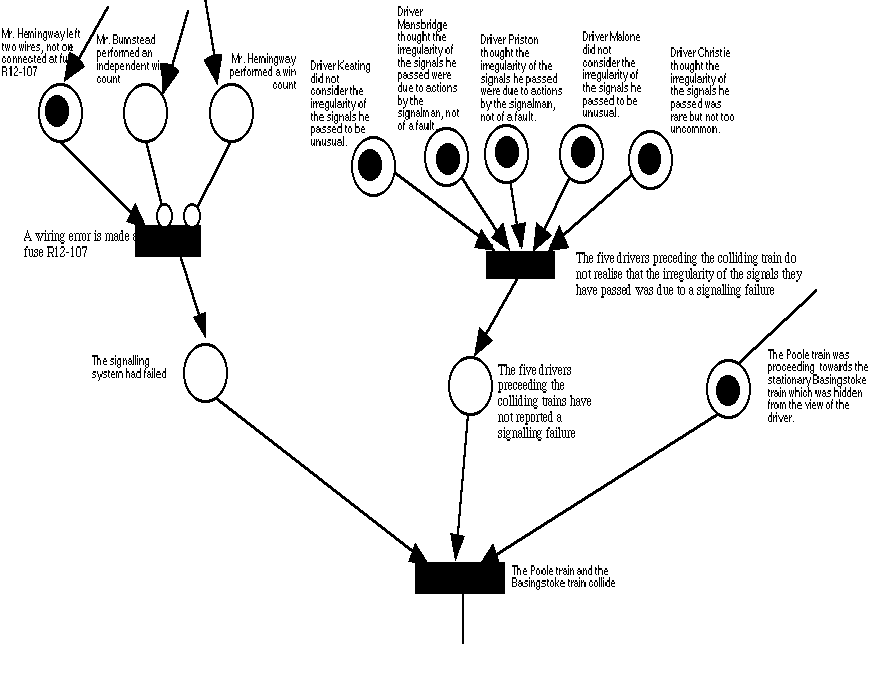
There are a number of limitations that complicate the application of Petri nets to analyse accidents that involve interactive systems. In particular they do not capture temporal information. Various modifications have been applied to the classic model. Levi and Agrawala (1990), use 'time augmented' Petri nets to introduce the concept of 'proving safety in the presence of time'. Unfortunately, even if someone can understand the complex firings of a 'time augmented' Petri net, they may not be able to comprehend the underlying mathematical formulae that must be used if diagrams, such as Figure 1, are to be used to analyse human 'error' and system 'failure' (Palanque and Bastide, 1995).
In Cause consequence analysis, separate diagrams are required for each critical event. Unfortunately, in an accident, there may be dozens of contributory factors and so several diagrams will be required. For instance in the Clapham accident, other diagrams would be required to represent the causes and consequences of bad working practices, limits on safety budgets and the events on the day of the accident. Such characteristics frustrate the application of these diagrams to represent and reason about the complex interaction between human and system failure during major accidents.
Fault trees are, typically, used pre hoc to analyse potential errors in a design. They have not been widely used to support post hoc accident analysis. They do, however, offer considerable benefits for this purpose. The leaves of the tree can be used to represent the initial causes of the accident (Leplat, 1987). The symbols in Figure 3 can be used to represent the ways in which those causes combine. For example, the combination of operator mistakes and hardware/software failures might be represented using an AND gate. Conversely, a lack of evidence about user behaviour or system performance might be represented using the OR/XOR gates. Basic events can be used to represent the underlying failures that lead to an accident (Hollnagel, 1993). Intermediate events can represent the operator 'mistakes' that frequently exacerbate system failures. An undeveloped event is a fault event that is not developed further, either because it is of insufficient consequence or because information is unavailable. This provides a means of increasing the salience of information in the notation (Gilmore, 1991). Less salient events need not be developed to greater levels of detail.
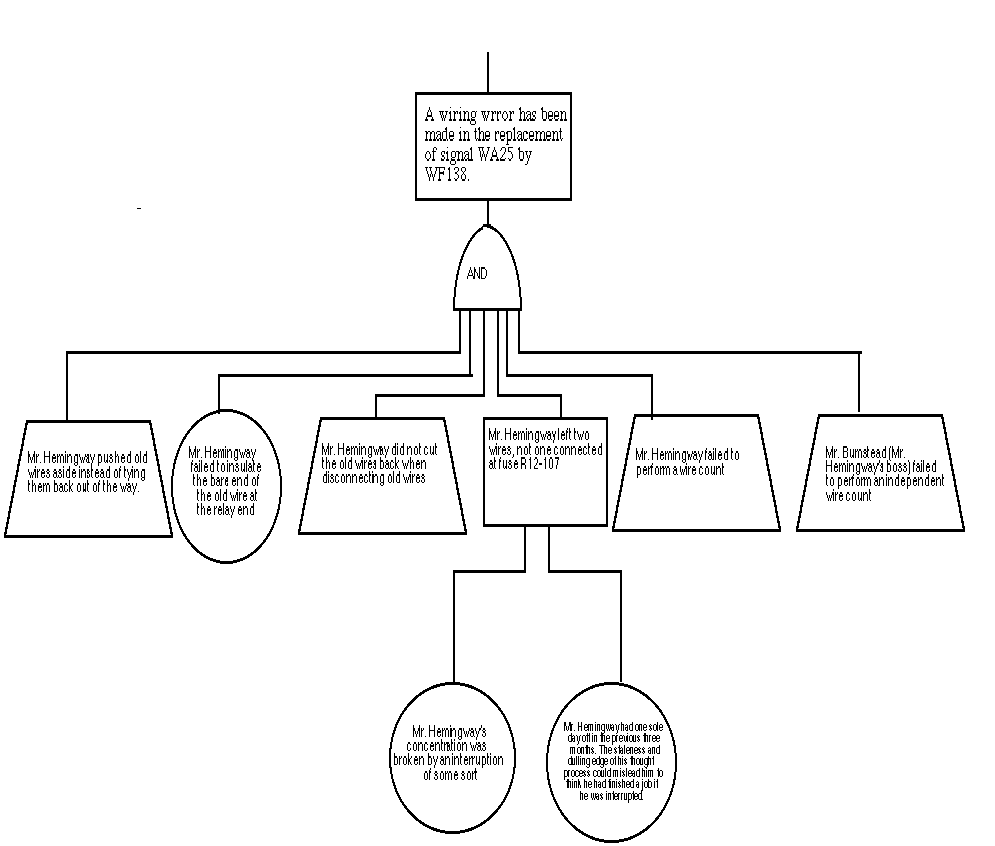
There are a range of important differences that distinguish the use of accident fault trees from their more conventional application. Fault trees are constructed from events and gates. However, many accidents are caused because an event did not take place (Reason, 1990). These errors of omission, rather than errors of commission typify a large number of operator 'failures'. Figure 4 illustrates the way in which fault-trees can be used to represent these errors of omission; Mr Hemmingway failed to perform a wire count, Mr Hemmingway's boss failed to perform an independent wire count.

Further differences between conventional fault trees and accident fault trees arise from the semantics of the gates that are used to construct the diagrams. Conventionally, the output from an AND gate is true if and only if all of its inputs are true. Accidents cannot be analysed in this way. For example, Figure 4 shows that the hardware error was the result of six events. In a 'traditional' fault tree the error would have been prevented if interface designers or systems engineers had stopped any one of these events from happening. In accident analysis, however, there is no means of knowing if an accident would actually have been avoided in this way. Most accident reports do not distinguish between necessary and sufficient conditions. An accident may still have occurred even if only one or two of the initiating events occurred. In this context, therefore, an AND gate represents the fact that an accident report cites a number of initiating events as contributing to the output event. No inferences can be made about the outcome of an AND gate if any of the initiating events do not hold.
The output of an OR gate is true if and only if at least one of itıs inputs is true. An OR gate can be used in an accident fault tree to represent a lack of evidence. Evidence can be removed accidentally or deliberately from an accident scene. Alternatively, evidence may be missing because the person holding the information died in the accident. For example, in the Clapham accident, we do not know if Driver Rolls actually noticed the irregularity of the signals he passed. The output of an XOR (exclusive OR) gate is true if and only if exactly one of the inputs are true. They are useful in accident fault trees when we know an intermediate event was caused by either of two events, but not both. This again raises an important semantic difference between our use of the Fault Tree notation and its more usual application to risk analysis. In particular, if both of the initial events are true in our interpretation then the intermediate event does not happen. This contrasts with the more conventional interpretation, of an XOR gate in which mutual exclusion is guaranteed. We retain our interpretation here because if it were found that both initial events were true then any subsequent analysis based on the XOR gate would have to be substantially revised. Figure 5 shows how an OR gate can be used to represent two reasons why Driver Rolls reduced his speed; either he was concerned about the behaviour of the signalling system or he saw the train ahead of him brake. It also illustrates the use of an XOR gate. There was no testing plan for the signalling system in this area because either a key official ignored his responsibilities or he was not aware that he was responsible for this task.

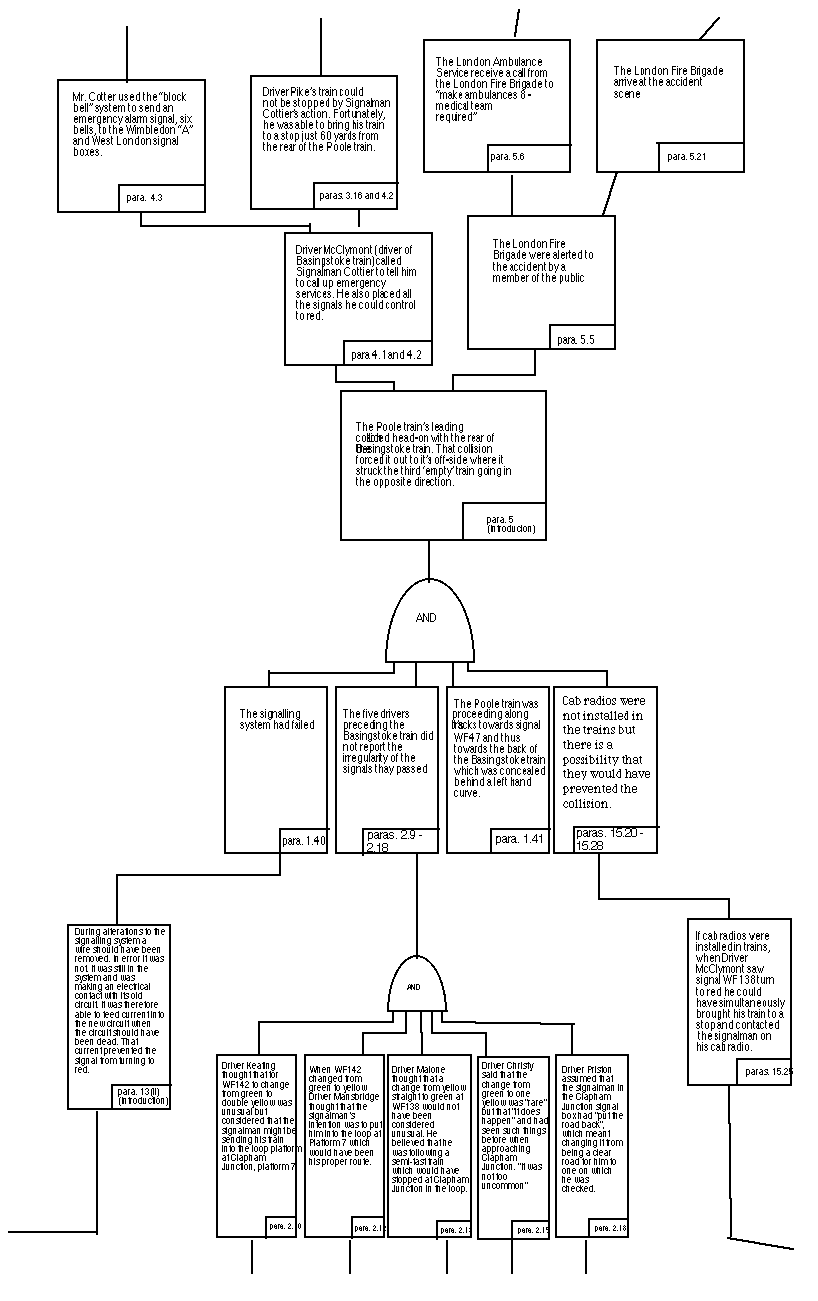
This diagram illustrates the way in which post-accident sequences stem from the collision. As can be seen, no gates are used after the central event. This reflects the certain, causal flow from the consequences of the collision. OR and XOR gates are not used because the accident investigators could accurately reconstruct the response to this failure. In other accidents, however, it will be necessary to extend the use of gates to reflect the lack of evidence about the aftermath of a major failure. Figure 7 illustrates both the strengths and the weaknesses of AFTs. The lines between nodes represent causal, temporal and logical relationships amongst the events leading to and from an accident. This overloading provides considerable expressive power. It can also be misleading. It is, therefore, important to introduce explicit representations of the flow of time between the elements of AFT diagrams.
Unfortunately, there are a number of limitations with this approach. In particular, real-time is not supported. This is significant because precise timings can have a critical impact upon an operator's ability to respond to a critical incident. We have, therefore, extended the fault tree notation to include real-time. It is important to note, however, that is not always possible or desirable to associate an exact time with all of the events leading to an accident. For instance, Figure 9 only provides approximate timings. Given limited evidence in the aftermath of an accident it is unlikely that operators will be able to recall the exact second in which they did or did not respond to a system failure.
A limitation with the approach shown in Figure 9 is that it does not account for the inconsistencies that may arise in any accident reporting process. Experience in applying AFT diagrams has shown that witnesses may frequently report different timings for key operator 'errors' or system 'failures'. In order to address such uncertainty, Figure 10 illustrates an annotation technique that we have used to explain potential contradictions in a timing analysis. This technique has proved particularly useful as it provides a focus for the detailed investigation of the timing evidence that is presented in a conventional accident report.
Figure 12 illustrates the application of this extension. The failure of the signalling system was a catastrophic event. The failure of the five preceding drivers to report the irregularity of the signals was a marginal 'error'. Such reports could not have prevented the accident if it had happened to the first train.
In order to apply this technique, analysts must decide whether criticality assessments will be based upon a pre-accident risk analysis or whether they will reflect changes that are the result of experience gained during the accident. In our view, both approaches are beneficial. They emphasise the relationship between the predictive use of risk assessments to support future design and our more analytical, descriptive approach to accident analysis. It is also important to emphasise that the categorisation is a subjective assessment. What is important is not whether the reader agrees with our particular assessment, but that the diagram makes the categorisation explicit. Too often these assessments are left as implicit judgements within the natural language of an accident report. As a result, accidents have occurred because companies and regulatory organisations have disagreed about the criticality of the events described in conventional documents (Johnson, 1996).
Much work remains to be done. Brevity has prevented us from providing empirical evidence that AFTs improve the usability of existing accident reports. We have, however, conducted a range of evaluations (Love, 1997). Initial results from these trials indicate that our extended notation can improve both the speed of access to specific material about an accident and can improve the overall comprehension of accident investigations. It is important to emphasise that the evaluation of AFTs is a non-trivial task. Accident analysts have little time to spare for experimental investigations. There are further methodological problems. For instance, it is difficult to recreate the many diverse contexts of use that characterise the application of accident reports. Finally, there are many reasons why evaluations should focus upon the long term effects of improved documentation rather than the short-term changes that are assessed using conventional evaluation procedures from the field of HCI. It may be many weeks after reading a report that engineers need to cross- reference a fact in it (Johnson, 1996). Further work intends to build upon research into the psychology of programming to determine whether it is possible to test for these long term effects through the improvement of documentation. For instance, Green has argued that structure maps can be used to analyse the cognitive dimensions of complementary notations (Green, 1991). This approach has not previously been applied to the graphical and textual notations that have been developed to represent human 'error' and system 'failure' during major accidents. We have criticised a number of other techniques as being unsuited for accident analysis because they quickly become intractable. In particular, we have argued that the multiple diagrams needed to represent different causes in Cause-Consequence Analysis would produce an unwieldy number of unconnected diagrams in the aftermath of an accident. We have not, however, demonstrated that AFTs will be any better. It seems unlikely that our approach will have significantly fewer nodes than these competing techniques. The benefits of our approach rest on the argument that a unified representation of multiple causes will provide a better overview than that provided by multiple Cause-Consequence diagrams. Further work intends to provide empirical evidence to validate this claim.
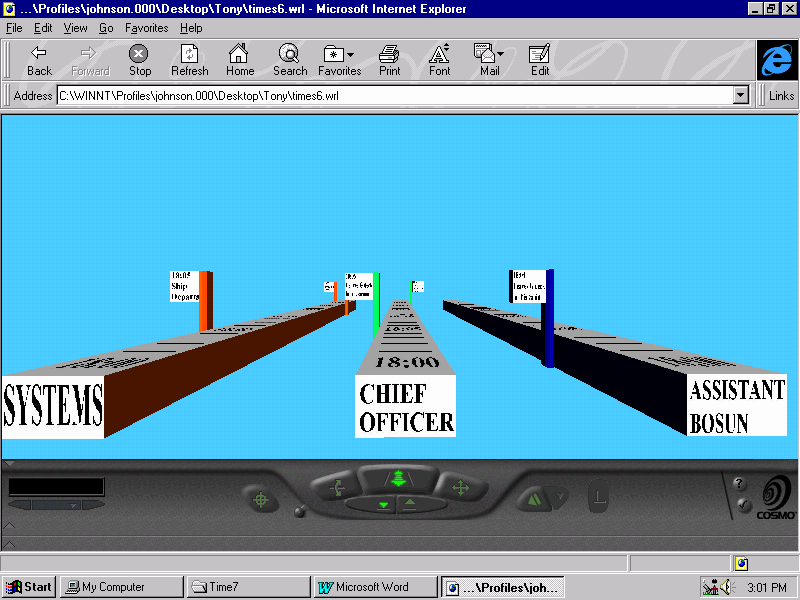
Brevity has also prevented a detailed discussion of tool support for AFT diagrams. We are developing a number of browsers that use the graphical representations to index into the pages of conventional accident reports. Many questions remain to be answered. In particular, it is unclear whether such tools can support multiple views of an accident without hiding the overall flow of events leading to major failures. Human factors analysts typically focus upon different areas of a tree than systems engineers. It is difficult to support such alternative perspectives and at the same time clearly show the interaction between systems 'failure' and operator 'error'. One possible solution would be to exploit the pseudo-3D modelling techniques provided by VRML, as shown below.
