This article appeared in the proceedings of SAFECOMP'99. Coyright belongs with Springer Verlag Lecture Notes in Computer Science who have kindly agreed to allow publication on this web site.


Evaluating the Contribution of DesktopVR for Safety-Critical Applications

Chris Johnson

Department of Computing Science, University of Glasgow, Glasgow, Scotland.

Email: johnson@dcs.gla.ac.uk, http://www.dcs.gla.ac.uk/~johnson

Desktop virtual reality (desktopVR) provides a range of benefits for training and visualisation tasks in safety-critical environments. Users can exploit conventional keyboards and mice to manipulate photo-realistic images of real-world objects in three dimensions using QuicktimeVR. Other approaches, such as the Virtual Reality Mark-up Language (VRML), enable users to navigate through three dimension models of virtual environments. Designers can exploit these techniques in training tools. They provide users with an impression of environments that are either too dangerous or too expensive to allow direct interaction during familiarisation exercises. DesktopVR also supports the visualisation of safety-critical information. For example, it can be used to provide engineers with an overview of the increasingly large and complex data sets that are being gathered about previous accidents and incidents. However, it is also important to balance the appeal of these techniques against a longer-term requirement that they actually support the tasks for which they are being developed. This paper, therefore, describes the problems that arose when two design teams attempted to validate the claimed benefits of desktopVR as a training tool for a regional fire brigade and as a visualisation tool for accident statistics.

Keywords: DesktopVR; Training; Visualisation; Accident Reports; Human Computer Interaction.

1. Introduction

DesktopVR techniques are being introduced into an increasing range of safety-related applications (Johnson, 1998). However, it is difficult to determine whether these presentation techniques actually support users' needs (Kaur, Sutcliffe and Maiden, 1998). The following sections illustrate this argument by focussing on the problems that arose during the validation of desktopVR in two safety-critical applications. The first focuses on the use of QuicktimeVR within a training package for a regional fire brigade. The second case study concentrates on the use of VRML to support the visualisation of events leading to major accidents. These are appropriate examples for this paper because they illustrate two radically different applications of desktopVR to support safety. In the former case, three-dimensional presentation techniques are being used to provide fire fighters with practical skills in the operation of specialist rescue equipment. In the later case, desktopVR techniques provide a more abstract overview of systems failure and human error during major accidents. In spite of such differences, it is possible to identify a number of common problems that arose during the validation and testing of these interfaces:

· it is hard to identify benchmarks that can be used to assess the usability of desktopVR in safety-critical systems;

· it can be difficult to identify the specific user groups and tasks that are to be supported by desktopVR in safety-critical systems;

· it is difficult to measure the contribution of desktopVR because it, typically, only forms part of a larger interface design within a complex safety-critical system.

These issues are not unique to desktopVR interfaces. Summative evaluation and benchmarking complicate the design of many other interactive systems. However, the consequences of failing to support user tasks make these problems particularly severe for safety-critical interface design. The risks of failure are also compounded by the lack of design guidance that developers can call upon during the application of desktop virtual reality.

2. The Fire Brigade Case Study

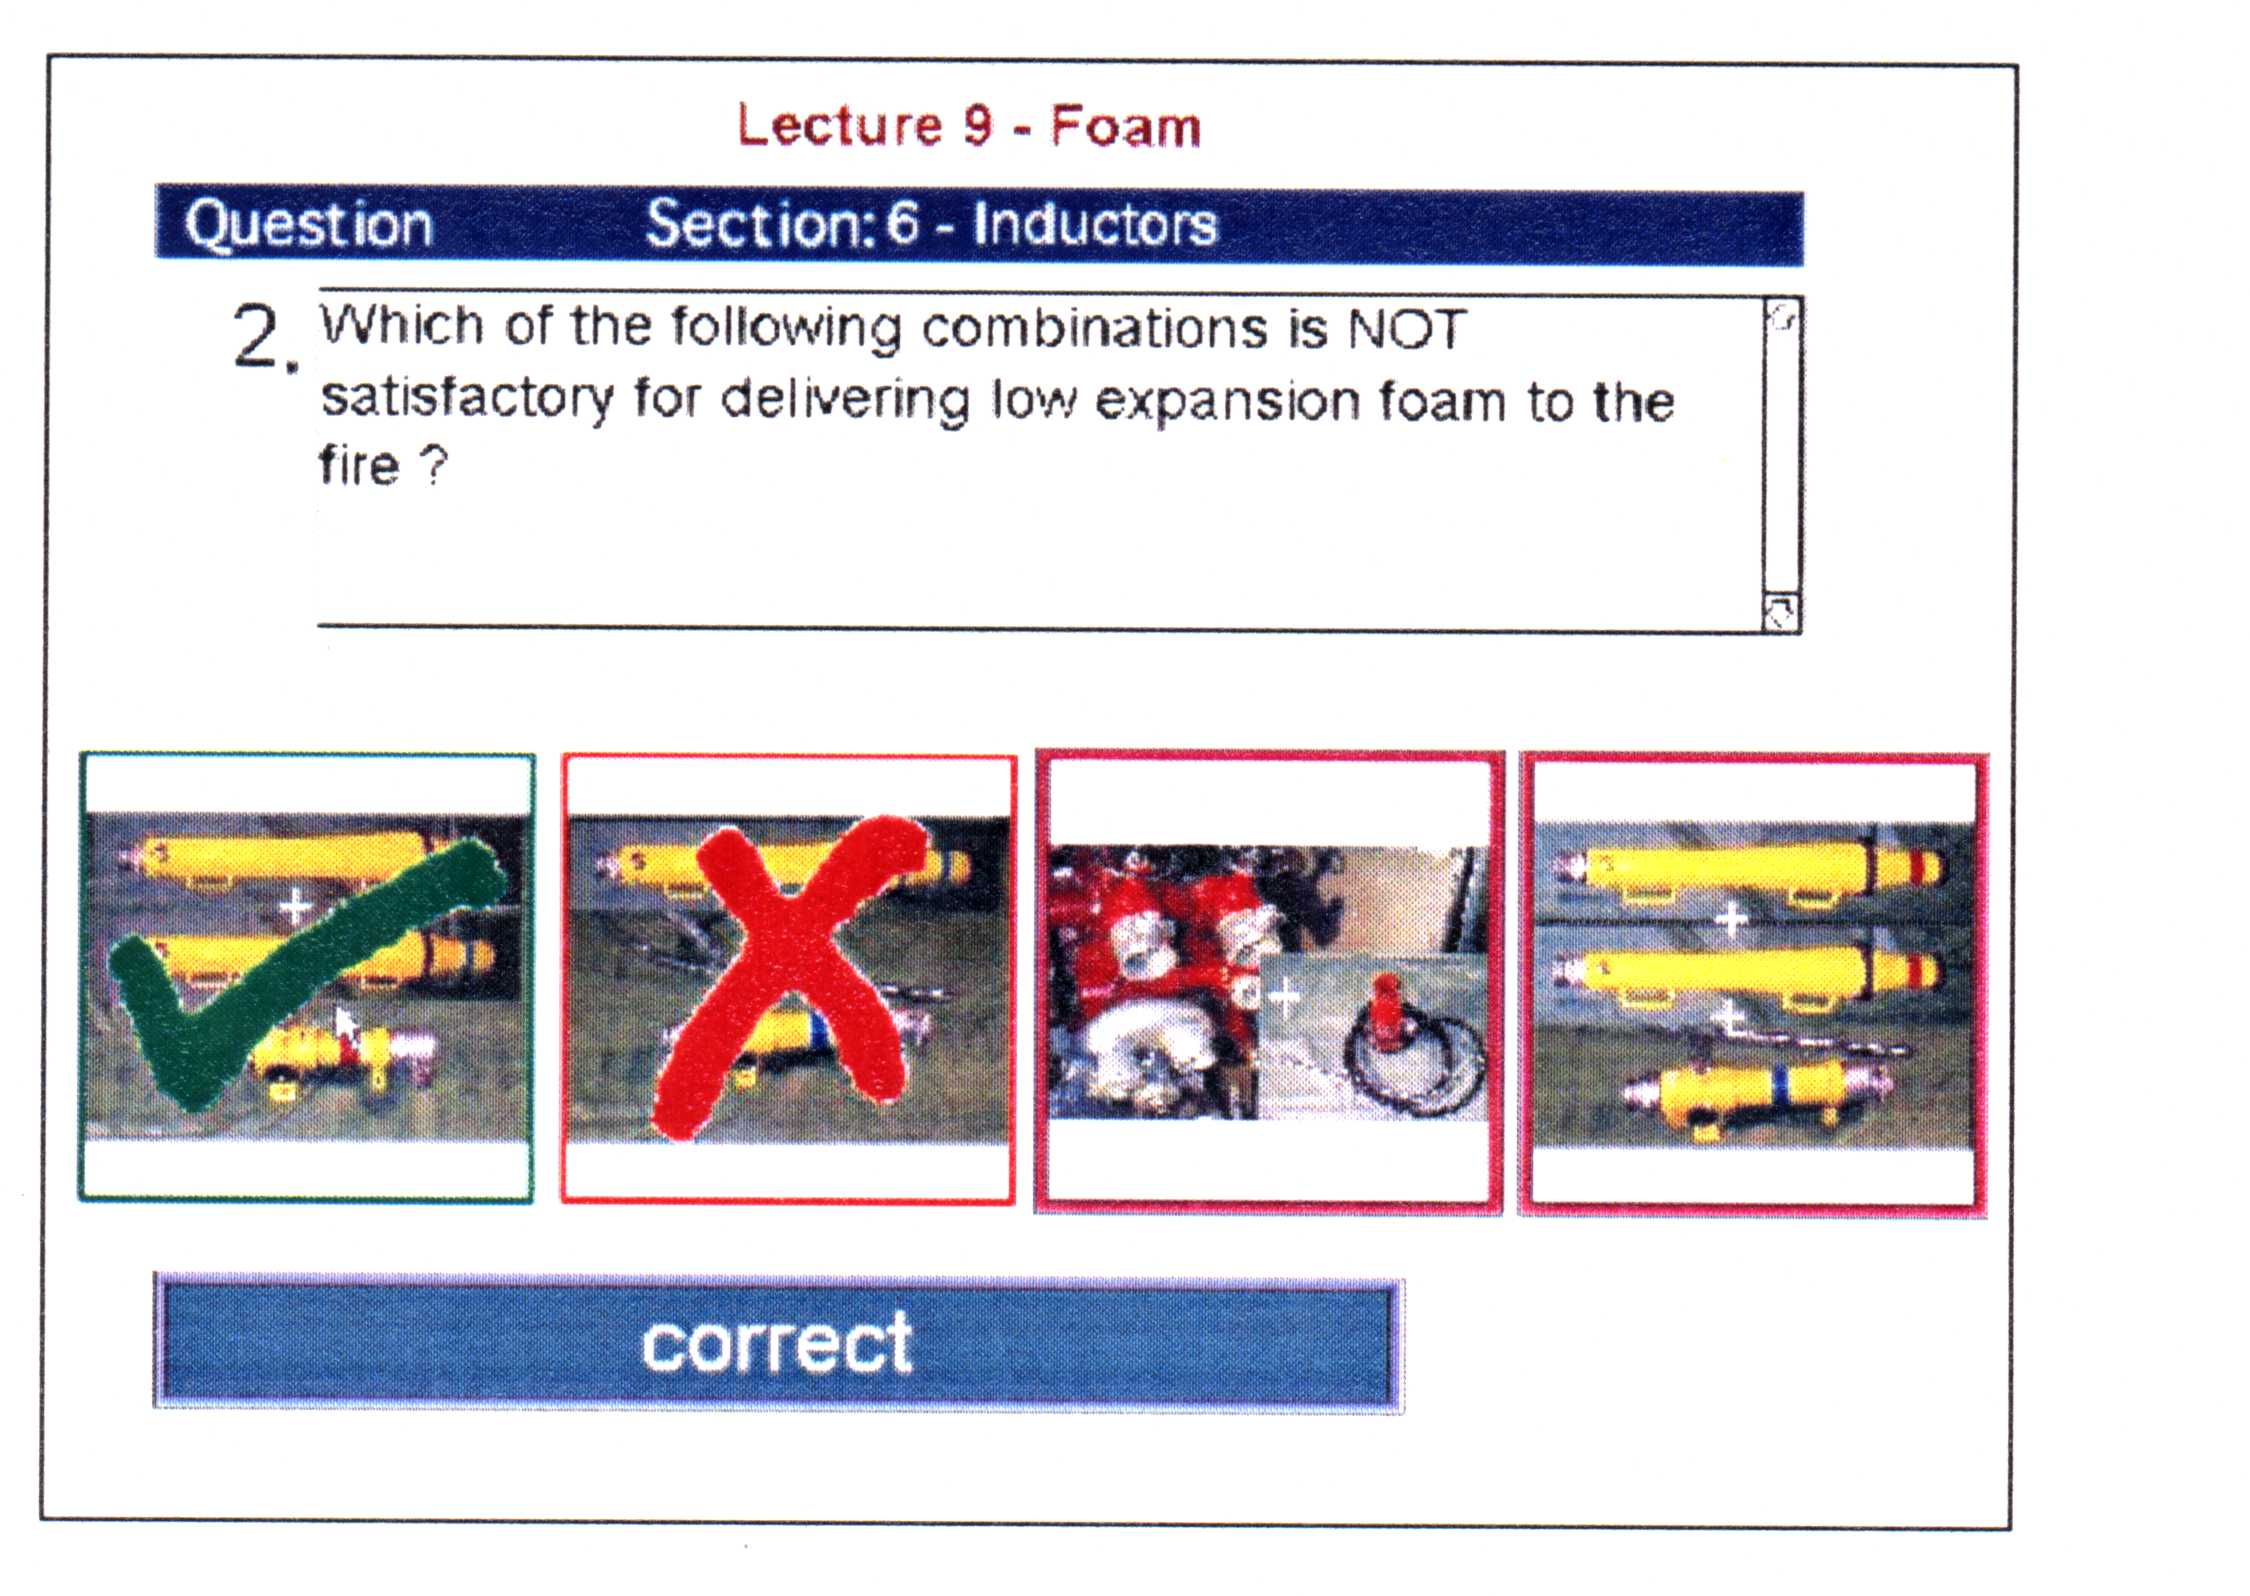
The training of Fire Officers is intended to provide both practical and theoretical skills. For example, they must learn how to operate breathing apparatus during fires. They are also expected to have specialised technical knowledge. Officers must know how to apply the latest foam technology to combat a range of different fires. Computer Aided Learning (CAL) tools are perceived by many in the Fire Brigade as a cost-effective means of delivering technical knowledge and practical skills. They are particularly appropriate for an organisation whose members are scattered amongst many different stations.

Fire fighters are often characterised by activist learning styles. It has been argued that they learn more effectively through direct experience than through the mediation of books or lectures (Johnson, 1998a). DesktopVR techniques, therefore, provide important benefits for the development of CAL in the fire brigade. Fire fighters can learn by interacting with objects in virtual environments rather than by passively listening to conventional lectures. Figure 1 shows how desktopVR techniques were applied to a Heavy Rescue Vehicle (HRV) training package. These vehicles contain specialist lifting and cutting equipment that may be necessary to extricate people from major road traffic accidents. The photo-realistic facilities of QuicktimeVR provide a three-dimensional representation of the storage area inside the HRV. Individual items of equipment can be found by exploring the desktopVR view, shown in the middle panel of Figure 1, or by selecting an item from the list on the right.

Figure 1: The Heavy Rescue Vehicle Training Package

The HRV package also provided detailed information about the equipment on the vehicle. Hypertext was used to provide electronic access to existing technical notes. Video clips were used to show the equipment "in action". Figure 2 shows how QuicktimeVR also enabled fire fighters to manipulate individual items of equipment. An important point about these models is that they provide three-dimensional views of items of equipment that are too heavy or cumbersome for an individual to lift. They are also available at times when fire officers cannot have direct access to the HRV itself. In our case study, the HRV had to be available to respond to emergencies for almost 24 hours each day. This implied that individual fire officers had almost no time to familiarise themselves with its equipment before they were actually involved in an incident.

Figure 2: An Object Rotation of Lucas Cutters on the Heavy Rescue Vehicle


3. The Accident Reporting Case Study

The previous section described how desktopVR provides fire fighters with an initial introduction to the equipment stored on an HRV. In contrast, the second case study focuses on the application of desktopVR to support the visualisation of more abstract safety-critical information. Most accident investigation agencies now place their reports on the World Wide Web. This is a relatively cheap means of disseminating information to companies and regulators (Johnson, 1997). However, we recently conducted an international survey to assess the effectiveness of these web sites. The questionnaire can be accessed on:

http://www.dcs.gla.ac.uk/~snowdonp/quest.html

The results were disappointing (Snowdon and Johnson, 1999). Most readers found that web-based accident reports were poorly structured. Many found them harder to read than previous paper versions. Such reactions arise because most investigation authorities simply convert paper-based reports into html or pdf format. Few agencies exploit the novel presentation techniques that are supported by today’s communications networks. In contrast, Figure 3 shows how an imagemap can be integrated into the Sheen report on the sinking of the Herald of Free Enterprise. Users select the relevant sections of the image to view all sections of the report that relate to the car deck, the bridge and so on. It is important to stress that these techniques are not intended to replace prose descriptions of major accidents. They do, however, provide relatively low cost means of augmenting the information in a manner that actually supports the readers’ comprehension of the events leading to human ‘error’ and systems ‘failure’. Figure 4 illustrates how desktopVR techniques can be used to extend such visualisations into three dimensions. These images show the layout of a cockpit using QuicktimeVR. Hypertext links again provide means of connecting objects in these environments with more detailed textual descriptions. This helps readers to gain a much more direct impression of the physical context in which particular events occur. Current work with the UK Health and Safety Laboratory is extending this approach from accident reports to more general litigation. Juries can be shown three-dimensional models of an accident scene to help them follow the legal arguments that are presented during court cases.

Figure 3: Integrating Imagmaps into Accident Reports


Figure 4: QuicktimeVR model for Aircraft Evacuation/Cockpit Familiarisation/Seat Booking

The approach, illustrated in Figure 4, helps users to view location dependent information. It is less good as a means of viewing the course of human error and systems failure over time. Figure 5 illustrates a three-dimensional timeline that avoids this limitation. It contains markers that indicate the actions and events that occurred at particular moments during an accident. The user can walk along the line in three dimensions to view events from the start of the accident looking forward into the future. They can also look at the events from any other perspective to gain a better view of the things that happened immediately before and after that moment in time. Flags are used to represent the events leading to the accident. If a flag is planted into the line then an exact timing is available. A flag that has not been planted indicates that the exact time is not known.

Figure 5: Using VRML to Visualise Events in Major Accidents

4. The Problems of Validating DesktopVR

The previous section briefly how desktopVR can be used to support two very different safety-critical applications. This section goes on to describe the problems that arose when we tried to assess the usability and the utility of these systems.

4.1 Problem 1: Establishing Benchmark Criteria for DesktopVR

The first problem in evaluating any system is to determine the criteria that can be used to assess "usability" (Kalawsky, 1998). This immediately raised problems for the first case study because we were developing an entirely new system. At the start of the project, the fire fighters did not have access to any CAL applications. None of them had used or even heard about desktopVR. This created considerable problems because we had no means of establishing the "benchmark" criteria against which to evaluate the new interfaces. The best that we could do was to issue a questionnaire to assess the fire fighters' attitudes about existing training techniques. Figures 6 and 7 present the results for 27 fire fighters from two different stations within the same region. These results guided the development of our desktopVR system. In particular, we strove hard to avoid the negative reaction towards passive lectures, shown in figure 7.

Figure 6: Perceived "Ease of Learning" in the Fire Brigade Case Study

Figure 7: Perceived "Effectiveness of Learning" in the Fire Brigade Case Study

Our problems began when we attempted to show that the new desktopVR system was better than the previous approaches. We were particularly concerned to show an improvement over conventional lectures and videos; the CAL system was not intended to reduce the amount of drill work or real incidents that the fire fighters were exposed to. Initially, we decided that we would re-issue the questionnaire. This would enable us to assess the fire fighter’s attitudes towards lectures, videos, drills, incidents AND the new CAL tools. However, this raised a number of objections:

the Hawthorne effect.

The fact that this project had support from the highest levels of the fire brigade made it difficult for us to judge whether we were receiving unbiased responses to questions about the utility of desktopVR within a training tool. The term "Hawthorne effect" refers to a 1939 study of car workers whose performance was improved simply by monitoring their activities; they produced more components simply because they knew that they were being watched.

the problems of measuring embedded effects.

It was less important for the fire brigade to show that our novel presentation techniques were effective than it was to ensure that the overall application satisfied their training objectives. The scores from a comprehension test were less important than the fire fighters’ performance during real incidents. This created a number of practical problems. It can be extremely difficult to identify objective criteria for real-world performance in safety-critical tasks. For instance, the time that it takes to extract a casualty is affected by many different contextual factors ranging from the make and condition of their vehicle through to the medical condition of that casualty. Of course, more qualitative criteria can be applied but this raises the problem of validating and recording those assessments in a manner that supports effective, long-term comparisons between subjects.

the problems of measuring longitudinal effects.

The average length of service amongst the users of our system was fifteen years. Any subjective assessment after a few months access to the new technology would provide a poor impression of the long-term effectiveness of desktopVR. Such validation exercises can be complicated by the fire fighters exposure to real-world incidents. During the validation of our system, one group was asked to use some of the theoretical material during a real incident. In balanced experimental techniques, half of this group should have been exposed to the CAL tool and half should have been exposed to conventional lectures. This would then have enabled us to make valid comparisons between these two different training techniques. It was impossible to achieve such a balance. In a longitudinal study, these problems raise further ethical problems because they imply that some fire fighters should be deprived of a training resource over a prolonged period to measure the effect of the absense of that resource on their performance.

4.2 Problem 2: How to Identify Users and their Tasks?

The second case study focuses on the application of desktop virtual reality to support the presentation of accident reports over the World Wide Web. VRML timelines enable users to ‘walk’ into a model of systems failures and operator errors immediate before and after a particular point in an accident. However, it remains an open question as to whether this novel interaction technique actually supports the tasks that people want to perform when they read an accident report. We, therefore, conducted an empirical evaluation in order to determine whether or not the techniques in Figures 3 and 4 were actually an improvement over paper based presentation techniques. A randomised procedure was used in which investigators were provided with one of three possible versions of an accident report: a paper-based document; an image map interface based on figure 3 and a more abstract VRML interface based on figure 4. They were then asked to perform five tasks using the version of the report that they had been allocated. These tasks were as follows:

    1. Write down the time that the Chief Officer left the Mess Room to return to the Bridge.
    2. What important events happened at 18:28?
    3. Write down the key events that happened on the bridge at approximately 18:23?
    4. Write down the time that the Assistant Bosun returned to his cabin.
    5. The Chief Officer gave conflicting evidence as to the time at which he left G deck to go to the Mess Room, write down the page reference where these conflicting statements are highlighted.

The first and fourth tasks tested the reader’s ability to find the timing of critical events. The second task tested the reader’s ability to locate information about a particular time in an incident. Task three linked both location and timing information. The final task tested higher level reasoning using the accident report. The results of an initial trial with five users performing these tasks are presented in the following figure.

Figure 8: Task Performance for the use of DesktopVR in Accident Reports

Figure 8 illustrates the strengths and weaknesses of empirical tests for the use of desktopVR in safety-critical applications. Such studies provide useful comparisons between alternative presentation techniques for well-specified tasks. However, the reliability of those results depends entirely upon the tasks being performed. Such evidence can be entirely misleading if the tasks do not provide valid examples of the sorts of activities that the readers of an accident report might want to perform with a new system. Of course, this is a general problem for the application of empirical techniques in user interface design. However, there are particular differences that make these limitations more acute in the context of desktopVR for safety-critical systems:

    1. It is more difficult to identify representative users and tasks for desktopVR applications than it is for other forms of interactive system. For instance, the interfaces illustrated in Figures 3 and 4 were specifically intended to improve the presentation of accident reports. In order to validate these designs through tests, such as those used in Figure 8, we first had to identify the potential readers of an accident report. This proved to be a non-trivial exercise. An initial survey identified the potential audience as including: regulators (both within an industry and from other industries); lawyers; academics in a wide range of disciplines; systems engineers; human factors engineers; project managers, journalists, politicians, trades union officials etc. Each of these user groups had a different set of tasks and priorities that they associated with the accident report. This diversity led us to question the validity of the tasks that were used in our initial validation.
    2. The consequences of using atypical tasks to establish the suitability of a human computer interface will be much greater in safety-critical systems than in other applications. One of the issues that emerged during our validation tests on the visualisation of accident and incident reports was that novel presentation techniques might actually bias the reader’s view towards particular conclusions. This is dangerous because it might lead them to ignore potential causes of human ‘error’ or systems ‘failure’. In particular, the visual appeal of accident simulations can persuade people to believe one particular version of events. This hypothesis is the focus for on-going research (Snowdon and Johnson, 1999). However, it underlines the point that changes to the presentation of safety-critical design information may have unexpected and potentially dangerous consequences.

Our experience has revealed that the problems of user and task diversity affect many other safety-critical applications of desktopVR. For instance, we were subsequently involved in the development of a QuicktimeVR model of a Boeing aircraft, shown in Figures 5. The intention was to use this model to show evacuation routes following a major accident. However, the product was also used to train passengers and fire-crews in evacuation procedures. It was then used by airlines to sell particular seats within the body of the aircraft. Sections of the model were also used to introduce psychologists and ergonomists to different cockpit configurations etc. This diversity of users and tasks affects much of the software industry. However, our experience is that it particularly affects desktopVR applications. The exploratory nature of these environments, combined with their superficial appeal, can create a large number of potential uses for this technology. Each of these users has particular informational needs and requirements. This creates further problems for the development and validation of safety-critical systems. The way in which an initial model can be marketed to diverse groups makes it difficult, if not impossible, for the designers and engineers who developed it to be certain that it actually supports the activities for which it is eventually being sold.

4.3 Problem 3: Assessing the Contribution of DesktopVR

Even if designers can identify particular user groups with particular tasks, it can be difficult to validate the contribution that desktopVR systems make to safety-critical interaction. For example, there is a danger that by focusing on particular training tasks, designers may overlook the broader context of VRML and QuicktimeVR applications. This point can be illustrated by Laurillard's (1993) conversational model illustrated in Figure 9. The right-hand components of the diagram represent the iterative process by which users modify their view of the concepts that are being taught. They adapt their descriptions (activities 4 and 9) and modify their actions (activities 8 and 10) as they learn from their tutor's feedback. The left-hand components of Laurillard's model describe the iterative process that informs the teacher's interaction with their class. Tutors modify the tasks that they set in response to a group's initial attempts to fulfil those tasks (activities 11 and 12). This is important within the context of safety-critical training because tutors must assess whether their class actually understands the critical points that are being communicated. If they do not then the tutor will have to modify their approach if safety is to be preserved.

Figure 9: Laurillard's Conversational Model for Effective Education.

Laurillard's model is important because it shows how the success or failure of desktopVR systems in safety-critical environments can depends upon a much wider range of training activities. In other words, VRML and QuicktimeVR techniques can only play a small role within the wider training activities of most complex organisations. Activity-implementation charts provide a practical means of assessing the way in which these presentation techniques fit into wider training activities. They can be used to identify the support that training tools provide for the various stages in Laurillard's model (Montgomery, 1997). Table 1 applies this approach to the fire brigades' technical training. A blank in the Teaching Mode column indicates that a learning activity is not supported by the current allocation of educational tasks. As can be seen, the desktopVR techniques in the HRV package (see figures 1 and 2) provide minimal support for many of the learning activities identified by Laurillard.

Activity

Teaching Mode

Example

1. The learner listens to a teacher's exposition.

Human
/desktopVR

Officer in charge gives a lecture
Fire fighter uses HRV package.

2. The learner describes the conception as they understand it, in the form of an essay or verbally.

Human

Fire fighter asks question at end of lecture

3. The teacher re-describes the conception to the learner based upon activity 2 and provides feeback.

Human

Officer in charge explains answer to question.

4. The learner attempts activity 2 again.

Human

Fire fighter confirms their understanding of Officer in charge's response.

5. The teacher sets a goal for the learner to complete.

_

_

6. The learner attempts the goal set in activity 5.

_

_

7. The teacher provides feedback regarding the learner's attempt at the task described in activity 6.

_

_

8. The learner modifies their actions in the light of feedback provided by the teacher.

_

_

9. The learner reflects on the interaction in order to modify their grasp of the concepts.

Other

Call-out may provoke reflection on technical training.

10. The learner modifies their actions in the light of reasoning at the "public" level of descriptions.

Other

Fire fighter may alter behaviour in practical exercise on basis of technical material.

11. The teacher modifies the task set to address some need revealed by the learner's descriptions or actions.

_

_

12. The teacher examines the learner's actions and modifies their description of the original conception.

_

_

Table 1: Activity-Implementation Chart for Technical Training in the Fire Brigade

In retrospect, the HRV tool failed to address many of the fundamental concerns raised by Laurillard's model. It supported the presentation of material, embodied in stage 1 of the model. It did not support stages 4-8. These activities focus on the use of tasks and exercises to provide students with feedback about their understanding of key concepts. These stages also provide the tutor with feedback about the need to improve their delivery techniques. Figure 10 presents a self-assessment tool that was, therefore, developed to accompany the HRV package. This screen implements a photographic multiple-choice question. Fire fighters are provided with feedback after each selection and are encouraged to provide further input if they make an incorrect selection.

Figure 10: A Photographic Multiple Choice Question

Similar problems affect the documentation of accident reports. A reader's understanding is only partially determined by their access to the information contained in desktopVR interfaces, such as those shown in Figures 4 and 5. Their analysis can be biased by previous experiences of human error and systems failure. Their interpretation can also be influenced by organisational pressures to accept a particular version of events. Such biases cannot easily be rectified. They are compounded by a lack of validation both for desktopVR systems and for conventional, paper-based accident reports. Many regulatory authorities completely neglect stages two and five of Laurillard’s model; they make no attempt to assess their readers' interpretation of the reports that they publish. Until this omission is addressed, there seems little prospect that novel presentation techniques will address the shortcomings of many accident reports.

5. Conclusions

At present, most desktopVR systems are being developed to support what can be called "secondary" safety tasks. They do not support direct interaction with safety-critical processes but they are being used to train operators about safety-critical tasks. They are also being used to support the visualisation of safety-critical information. This paper has described a number of practical problems that have arisen during initial attempts to validate this new generation of interactive systems:

· it is hard to identify benchmarks that can be used to assess the usability of desktopVR in safety-critical systems;

· it can be difficult to identify the specific user groups and tasks that are to be supported by desktopVR in safety-critical systems;

· it can be difficult to measure the contribution of desktopVR because it, typically, only forms part of a larger interface design within a complex safety-critical system;

The paper has, therefore, moved from the specific problems of assessing particular desktopVR interfaces to the general issues of evaluating desktopVR within complex organisations. It is discouraging that we are faced by so many problems and so few solutions.

Acknowledgements

Thanks are due to the members of Glasgow Interactive Systems Group (GIST). In particular, Brian Mathers, Anthony McGill, Pete Snowdon, Alan Thompson all helped with the design, implementation and testing of the systems described in this paper.

References

C.W. Johnson, Ten Golden Rules for Video over the Web. In J. Ratner, E. Grosse and C. Forsythe (eds.) Human Factors for World Wide Web Development. 207-224. Lawrence Erlbaum, New York, United States of America, 1997.

C.W. Johnson, The Problems of Validating DesktopVR. To appear in People and Computers XIII: Proceedings of HCI'98, Springer Verlag, Berlin, 1998.

C.W. Johnson, Why `Traditional' HCI Design and Evaluation Techniques Fail With DesktopVR. In IEE Colloquium Digest 98/437, 1998a.

R.S. Kalawsky, New methods and techniques for evaluating user performance in advanced 3D virtual interfaces. In IEE Colloquium Digest 98/437, 1998.

K. Kaur, A. Sutcliffe and N. Maiden Improving Interaction with Virtual Environments. In IEE Colloquium Digest 98/437, 1998.

D. Laurillard, Rethinking University Education: A Framework for the Effect ive Use of Educational Technology, Routledge, London, 1993.

M. Montgomery, Developing a Laurillardian Design Method for CAL. In Proceedings of Ed-Media '97. Association for the Advancement of Computing in E ducation, 1997.

P. Snowdon and C.W. Johnson, Results of an International Survey into the Usability of Accident Reports. Submitted to IEE Conference on People in Control, 1999.