There is also a more recent paper arguing against the simplistic use of utility theory in the design of mobile/distributed systems.
This paper argues that marginal utility can be extended from the domain of Micro- economics to explain some of the problems that frustrate interaction with distributed systems. In particular, it is argued that concave utility curves can be used to analyse the electronic gridlock that occurs when remote systems cannot satisfy the number of demands which users make upon their services. Convex utility curves represent the information saturation that occurs when users cannot extract important documents from a mass of irrelevant information. The paper goes on to argue that marginal utility can also be used to identify a range of interface techniques that reduce the problems associated with electronic gridlock and information saturation.
Keywords: electronic gridlock; information saturation; marginal utility.
Recent estimates place the number of Internet users at almost seventy million (Johnson and Kavanagh, 1996). The very success of distributed computing has, however, exacerbated a range of existing usability problems. For example, retrieval delays have reached a stage where it can take thirty or forty minutes to download relatively small files from busy sites (Johnson, 1995)..
The term 'electronic gridlock' is used to refer to situations in which networks and servers cannot cope with the amount of information that is being requested from them. Recent innovations in caching, including the widespread use of mirror sites, have done much to increase the efficiency of network communications (van Rijsbergen, 1979). However, the majority of Internet users still suffer from the 'bottlenecks' created by modem and ethernet connections. These bottlenecks increase the costs, in terms of retrieval delays, that are associated with information retrieval. As more and more people access a greater and greater volume of data, there has been an increase in the amount of time that is required to download information (Johnson, 1995). Kuhmann (1989) argues that these retrieval delays have a profound impact upon the quality of interaction with distributed systems.
In contrast to electronic gridlock, the term 'information saturation' refers to situations in which users simply cannot cope with the volume of information that is offered by remote sites. Hiltz and Turoff (1985) argue that this problem stems from 'information entropy'; distributed resources are insufficiently well structured for users to select the items that they need. This again increases the costs associated with information retrieval because users must invest considerable time and energy in locating necessary information. The introduction of free-text retrieval systems has reduced these problems. However, the rapid duplication and reproduction of electronic documents more than offsets the benefits that many of these systems can offer.
Unfortunately, interface designers have relatively few techniques that can be used to represent and reason about electronic gridlock and information saturation (Johnson, 1995). These problem stem from users' attitudes to the value of information and the time required to retrieve it. For example, electronic gridlock occurs because users are forced to invest large amounts of time in order to retrieve each item of remote information. As retrieval delays increase, the value of information decreases. Users move to other tasks. They may also develop coping strategies that avoid accessing remote information. Information saturation occurs because users must invest large amounts of time in identifying relevant information from a mass of irrelevant data. Again, these costs may outweigh any benefits to be derived from the information as users invest increasing amounts of time in locating necessary resources. It is, therefore, important to consider the relationship between the value that users associate with information and the cost of retrieving that information in terms of the retrieval delay. In order to do this there must be some means of representing and reasoning about the costs and benefits of interaction with distributed systems.
Micro-economists have developed the notion of marginal utility to analyse the relationship between cost and value (Puppe, 1991). Marginal utility is defined to be the additional benefit that can be obtained through the consumption of an extra unit of some good or service. Marginal utility can be thought of in terms of the additional value that may be obtained through each additional unit of time that is invested in acquiring a remote resource. Utility, in turn, can be thought of as a measure of 'desire' or the capacity of a good or service to satisfy a need. The exact nature of this desire will vary from task to task, however, the underlying notion of value will not (March and Simon, 1958). A number of different approaches can be exploited to represent the utility that users associate with items of information. For instance, satisficing identifies the subjective 'desire' for a good or service by iteratively refining the constraining equations that characterise preferences between tasks and services. Unfortunately, the difficulty of accurately identifying an individual's preferences has been a common theme of recent research in economics and decision theory (Puppe, 1991). One means of avoiding this problem is to construct high level models that characterise common attitudes towards utility. This approach suffers from a lack of empirical evidence. It does, however, provide a starting point for more detailed discussions about the costs and benefits of information retrieval.
Section 2 argues that electronic gridlock is characterised by concave utility curves. The perceived benefits to be obtained from spending time on a request will quickly fall as the retrieval delays increase. In order to reduce this effect, users must be able to assess the quality of a remote resource before they download it. This flattens the subjective utility curve; the anticipated value of information will maintained because users can determine whether or not it will be worth waiting for before they issue a request. Section 3 goes on to demonstrate that the problems of information saturation are characterised by convex utility curves. Here, the volume of information provided to the user initially results in relatively high levels of utility. However, diminishing marginal returns quickly set in as the user has to sift through the mass of data to find the information that they are actually interested in. Section 3 goes on to describe an information retrieval system that exploits user-defined measures of relevance to match natural language queries with large numbers of documents. This has the effect of delaying the point of diminishing marginal returns because users can filter the mass of detail that is presented by the system. Section 4 presents the conclusions that can be drawn from this work. Directions for further research are also identified. It is argued that more work is required if explicit or inferred measures of relevance and value are to effectively combat the problems imposed by information saturation and electronic gridlock.
Electronic gridlock stems from the bottlenecks and system failures that exacerbate information retrieval over distributed networks. These problems increase the costs, in terms of the users' time, that must be met in order to retrieve a remote resource.
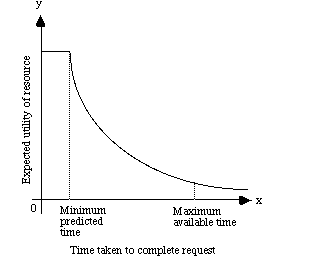
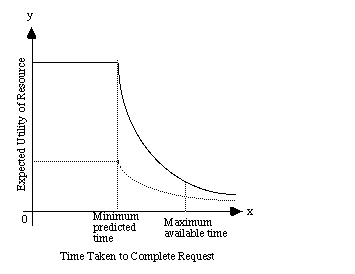
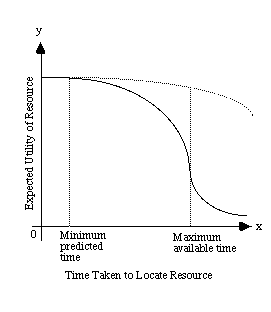
Figure 1 presents a cost curve that characterises the problems associated with electronic gridlock. Initially, the user has some anticipated or predicted minimum for the amount of time that it will take to complete any transfer. Up to this point, the utility of any information retrieved will be relatively high. Documents received before the minimum predicted period can be seen as a bonus from the user's perspective.
After the minimum predicted time, the anticipated value of the information will decline. There are many reasons for this. The time taken to retrieve a document may exceed the total time that is available to for any associated tasks. Eventually, there will come a point when users simply 'run out of time'. At this stage, the marginal utility of any remote information will be very low because the user simply cannot afford to wait for the data to be retrieved. O'Donnel and Draper (1995) have shown that users will also begin to exploit coping strategies that reduce their reliance on remote information that carries high time penalties.
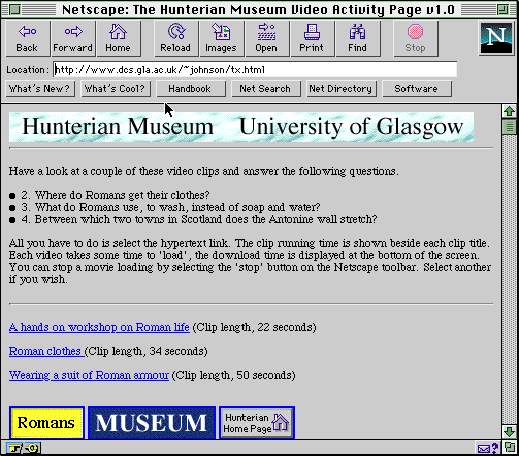
Figure 1 provides a high-level model of the costs and benefits of information retrieval under electronic gridlock. It does not, however, provide interface designers with concrete means of combating the frustration and error that result from retrieval delays. Figure 2 illustrates a web page that does exploit 'concrete'' techniques to reduce electronic gridlock. Users are provided with an indication of the size of a remote resource before they access them. This, together with some contextual knowledge of network conditions, can help users to make better predictions about the minimum time to retrieve a remote resource (Johnson and Kavanagh, 1996). In this example, the size of a video was indicated in terms of clip length. This was chosen rather than file size because it had more meaning to the school children who were intended to access this resource.
The interface shown in Figure 2 combats the problems of electronic gridlock by extending the period of high relative utility that is associated with the interval before the minimum expected retrieval period. This is illustrated in Figure 3. It is important to stress that the delay which is predicted by the user can be very different from the actual delay. This will be effected by transient conditions, such as the time of day and the loading of any intermediate networks. Figure 3 also shows how indications of resource size can help users to synchronise their retrieval tasks with their wider activities. For instance, if the anticipated delay extended any further in this graph than it might begin to exceed the maximum anticipated time available for the task. Users might then not decide to embark upon the retrieval until more time was available.
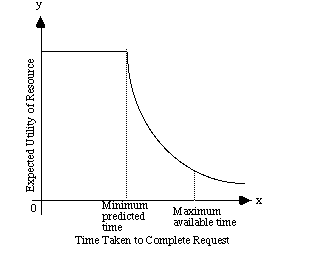
Figure 4 illustrates an alternative means of combating electronic gridlock. Instead of representing the size of a remote resource, this interface provides users with information about the quality of a document. For example, the video material provided via the interface in Figure 2 was produced by a professional crew working for a national broadcaster. It was processed using 'state of the art' compression techniques. Usability studies were conducted into optimal file lengths for web-based retrieval. Unfortunately, simple hypertext links, such as those shown in Figure 2, provide users with little or no indication of these production values (Johnson and Kavanagh, 1996). Figure 4, therefore presents an alternative approach which uses still images from the compressed video to indicate the quality of the remote resource. The revised interface shown in Figure 4 had a profound impact upon users' attitudes towards retrieval delays. Significantly more requests were abandoned using the simple hypertext tags of Figure 2 when compared to the thumb-nail images in Figure 4. This was true even for relatively long clips of over 70 seconds (Johnson and Kavanagh, 1996).
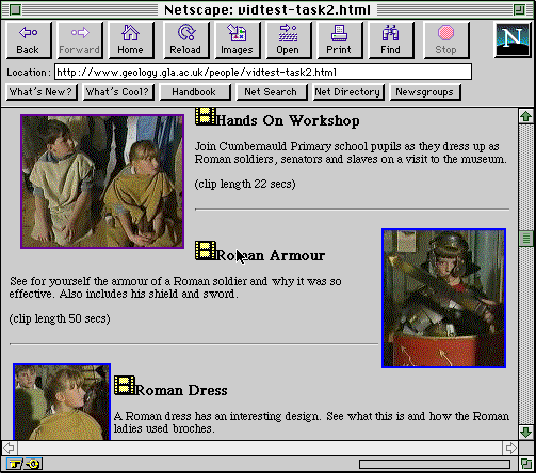
Figure 5 presents a cost curve that explains the observed reduction in abandoned requests between the interfaces shown in Figures 2 and 4. This curve shows the impact that indications of resource quality have upon expected utility. The previous cost curve, shown as a dotted line in Figure 5, is transformed along the Y-axis. This indicates the rise in expectations that can be produced through effective interface design.
There is strong initial evidence to suggest that such techniques also encourage users to increase the time devoted to retrieval tasks (Johnson and Kavanagh, 1996). This could be indicated in Figure 5 by moving the maximum available time along the X axis. Conversely, an interface which indicated relatively low production values would have the opposite effect of reducing the absolute level of the anticipated utility. This can be shown by a transformation of the cost curve down the Y axis.
Figures 6 a) and b) provide initial qualitative evidence to back up the assertions made in the previous paragraph. These diagrams present the results of an evaluation using twenty school children to access the two competing interfaces illustrated in Figures 2 and 4. The graph on the left shows a strong negative reaction to the simple textual labels. The absence of any results for the longer videos over 50 seconds indicates that all attempts to retrieve these clips were abandoned. The graph on the right presents the same results for the web page shown in Figure 4. In this instance, the school children were very satisfied even for the longer clips. Further details about this empirical work and a justification for the relatively small sample size can be found in Johnson (1997). The important point here is that the retrieval delays and video material were held constant between the two conditions. The indications of production quality resulted in an observable increase in qualitative satisfaction or utility.
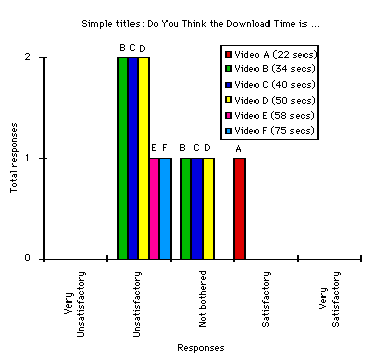
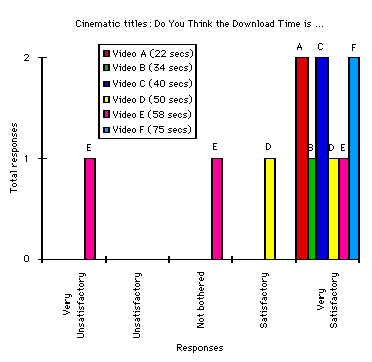
Figure 6 raises further questions about the validation of our utility curves. In particular, it illustrates some of the problems that arise when trying to map subjective concepts, such as utility, onto empirical results. This is a well known problem in the field of economics. The key result is that it is impossible to define a unit of utility without reference to the users information retrieval task. Terms such as 'cost/benefit', 'value', 'need', 'desire' or 'preference' cannot really be measured except in terms of particular domain or problem characteristics. It, therefore, follows that figures such as Figure 6 cannot fully capture the utility of Figures 2 and 4 for all information retrieval tasks. Here we are testing school children performing a browsing task. Elsewhere we contrast these results with other groups of users pursuing more goal directed tasks (Johnson, 1997).
Information saturation occurs when users simply cannot find relevant documents amongst the mass of information that is provided by remote sites. Cost curves can be used to analyse the underlying reasons for this problem in terms of the relationship between the utility of information and the time taken to access it over remote networks.
Figure 7 characterises the marginal utilities that are associated with information saturation. Initially, the value of remote information will be high. This represents the situation in which users quickly find the information that they were looking for. As time goes on, the value associated with an item of information will decline. In particular, the marginal utility will fall more rapidly as users approach the maximum amount of time that is available for their task. Beyond this point, users will not be able to use the information even if they can find it. In contrast to the previous cost curves, Figure 7 is convex because users increase their chances of finding exactly the item that they are looking for by increasing the amount of time that they invest in the search process. This is represented by the relatively high marginal utilities shown immediately after the minimum predicted search time.

Information saturation occurs when users are over-whelmed by the volume of data that is provided by remote sites. This is not a novel problem. There are a large number of search engines that can help users extract relevant information from a mass of background 'noise' (van Rijsbergen, 1979). For instance, we have recently extended the Inquery tool to support free-text retrieval for multimedia information. Figure 8 shows the results of a query about wooden artefacts in an ethnographic collection. The HyperText links can be selected to retrieve photographs, videos or text about the objects in question. Alternatively, users can build their own pages by selecting any of the check boxes under the assemble page, AP, column. The rankings are automatically calculated from the relevance of the document to the query. In order to do this, the system exploits a thesaurus of pre-defined synonyms. Associated with each synonym is a degree of belief. If for example, a user entered a query about a canoe then the system might retrieve any document which contained the word kayak. Associated with that document might be a 70% belief that any query relating to canoes would be satisfied by a document referring to kayaks. In Figure 8, this is illustrated by a belief of 0.501 (50%) that a query about wood will be satisfied by a document on a 'Hand Adze or Chisel'. This systems, therefore, automates the filtering process that would otherwise have to be performed by the manual inspection of distributed resources.
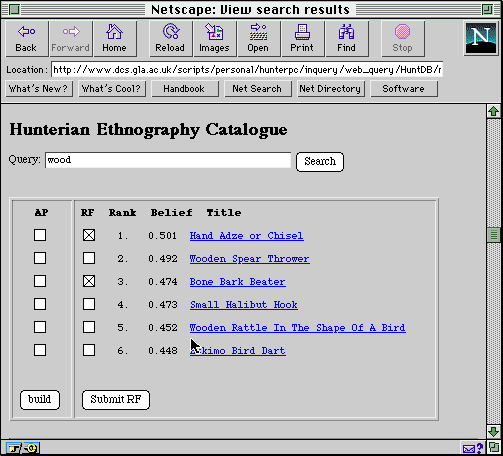
Figure 9 illustrates the impact that such systems have upon the expected utility of remote resources. Retrieval engines offer relatively high levels of utility for a minimal investment of time. A range of documents may be returned for an initial query. These can then be searched by subsequent queries to find the exact document that the user is looking for. This iterative search process ensures that the marginal utility of time spent on a search task can remain relatively high. The more time that a user invests in a query, the better the results may be.
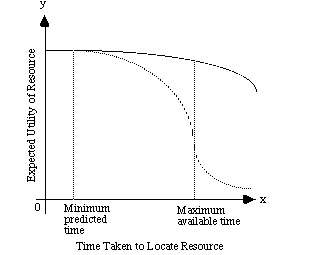
Figure 9 presents an almost constant rate of marginal utility. This is an ideal. In reality, the cost curves associated with retrieval engines are liable to exhibit a number of peaks and troughs. If there were a rapid rise in marginal utility then any query which terminated before that rise would be unlikely to contain a relevant document. Conversely, if there were a rapid fall in the marginal utility then many users would abandon their requests before that point. These peaks and troughs are caused by the precision and recall characteristics of the system. Precision indicates the extent to which a tool retrieves only those documents that are relevant to a user's task. Recall indicates the extent to which a tool retrieves all of those documents that might be relevant to a user's task. Figures 10 a) and 10 b) illustrate what can happen as the precision and recall of an information retrieval tool moves away from the ideal shown in Figure 9.

a) low recall
b) low precision
In Figure 10 a) the low recall of an information retrieval system initially results in a lower marginal utility than that of Figure 7, the previous cost curve is shown as a dotted line in Figure 10. This lower utility occurs because users cannot be sure that the system will retrieve all of the documents that may be relevant to their task. The peak to the right of the minimum predicted recall time occurs because users will have to issue further queries to ensure that they have actually seen all of the documents that may be relevant to a particular query. Figure 10 b) illustrates the effects of low precision. The retrieval of many irrelevant documents alters the shape of the cost curve so that it begins to resemble the characteristic shape of that associated with information saturation, shown in Figure 7. In a pathological case, successive queries may not refine the selection to find the necessary documents, as shown in Figure 9, but may actually reduce the value of the results by introducing new documents that are not relevant to the users' task.
This paper has argued that marginal utility can be used to explain some of the usability problems that frustrate interaction with distributed systems. The limitations of network technology and server capacity have introduced significant delays when sending or receiving information over the Internet. This problem has been termed 'electronic gridlock'. We have shown that such conditions are characterised by concave utility curves. The returns associated with investing more and more time into a request rapidly fall to a point where most users will simply abandon their requests.
We have also used the concept of marginal utility to analyse the problem of information saturation. This arises because many sites provide so much information that users are forced to invest large amounts of their time looking for necessary information. Such problems are characterised by convex utility curves. Initially, users can increase the rewards associated with their retrieval task by investing more time in their search. They will, however, reach a point where diminishing marginal returns set in. At this point, the search task may actually eat into the time reserved from any associated tasks that depend upon the remote information.
We have also described how a range of interface design techniques can be used to alter the utility curves associated with electronic gridlock and information saturation. For example it its possible to raise subjective assessments of utility by providing users with clear indications about the production value of remote resources. Similarly, information retrieval engines can be used to reduce the impact of diminishing marginal returns for search tasks; users can increase the value of their queries over time by successively refining their initial selection.
As mentioned in the introduction to this paper, it is important to provide empirical confirmation of the subjective observations that are reported in the paper. Elsewhere we describe initial work that has determined the tolerance thresholds for retrieval delays over the world wide web (Johnson and Kavanagh, 1996). However, this evidence was obtained using conventional experimental techniques. There is growing evidence in the field of economics to indicate that these techniques are insufficient. In particular, Puppe (1991) argues that attitudes towards utility cannot be correctly understood without considering individual attitudes towards risk. In other words, the utility curves presented in this paper must be further refined to show the attitudes of risk preferring and risk adverse people when faced with retrieval delays and complex search tasks. Further work intends to explore the consequences of such an analysis, For example, a risk preferring user may choose to issue and abandon many requests in the hope that they will 'strike lucky' when looking for a remote resource, A risk adverse user might choose a more 'rigorous' strategy which completes more transactions but issues less requests.
Thanks go to the members of the Glasgow Interactive Systems Group (GIST) and Glasgow Accident Analysis Group. Particular thanks go to Paul Hunter and Jim Kavanagh who drove the implementation work behind the video pages and the catalogue retrieval application. Chris Johnson's work is supported by the UK Engineering and Physical Sciences Research Council, grants GR/JO7686, GR/K69148 and GR/K55040.