Novel Visualisation Techniques for the Presentation of Accident Reports
Chris Johnson,
Department of Computing Science, University of Glasgow, Glasgow, G12 8QQ,
Tel: +44 141 330 6053, Fax: +44 141 330 4913
johnson@dcs.gla.ac.uk, http://www.dcs.gla.ac.uk/~johnson
Accident reports describe the causes and consequences of human error and systems failure. They are intended to ensure that the weaknesses of previous applications are not propagated into future generations of interactive systems. They, therefore, have an important role to play in the development of safety critical interfaces. Existing paper-based reporting techniques have, however, remained relatively unchanged over the last century. During this time, the introduction of microprocessor technology has significantly increased the integration of heterogeneous processes. There have also been changes to the techniques that drive accident analysis. There is an increasing awareness that contextual and organisational issues must be considered in addition to any narrow findings about operator "error". The integration of safety-critical interfaces and the development of organisational approaches to accident analysis have created new challenges for the presentation of accident reports. The scope and complexity of these documents is increasing. Fortunately, most regulatory authorities have now begun to disseminate their accident reports over the World Wide Web. It is, therefore, possible to extend the application of advance visualisation and navigation techniques from other areas of Human Computer Interaction (HCI) to support the readers of these critical documents. Unfortunately, most agencies focus on the Web as a means of dissemination rather than communication. Paper based reports are directly translated into Hypertext Mark-up Language (HTML) or Adobe’s Portable Display Format (PDF). This creates a number of usability problems. The HTML approach suffers from the well-known problems of reading large on-line documents. The PDF approach prevents many search engines from effectively retrieving information about similar accidents. This paper, therefore, describes a number of alternative approaches that support the presentation of accident reports. These visualisation techniques are intended to more fully exploit the opportunities created by the electronic dissemination and communication of accident reports.
Keywords: accident reports; human error; visualisation; world wide web.
1. Introduction
Accident reports play an important role in the development, maintenance and operation of safety-critical interfaces. They are intended to ensure that the weaknesses of previous applications are not replicated in future generations of interactive systems (Reason, 1997, Hale, Wilpert and Freitag, 1997). Unfortunately, many of today’s accident reports exploit the same presentation format and structure that was first used at the beginning of the twentieth century. This would not be a concern if the nature of accident investigation had not changed radically over the same time period. However, the information that these documents must convey has changed in the last twenty years. In particular, the introduction of computer technology has rapidly increased the integration of heterogeneous production processes. This has now reached the point where isolated operator "errors" or single equipment failures have the potential to create complex and long lasting knock-on effects within many different applications. The disruption caused to the rail network in South-West London following from the Ladbroke Grove collision provides ample illustration of this point. Accident reports must now not only consider the immediate impact of an accident but also the way in which emergency and other support services responded in the aftermath of an incident.
Technological change is only one of the factors that have changed the nature of accident reporting. There has, for example, been a move away from "blaming the operator" (Perrow 1999, Johnson, 1999). This wider perspective has resulted in many regulatory organisations looking beyond what are termed the "catalysts" of an accident to look at the deeper seated organisational issues that form the "latent" causes of many failures.
Technological change and new approaches to accident investigation have increased the length of many accident reports. For instance, the Cullen (1990) investigation into the Piper Alpha accident is over 500 pages and occupies two volumes. It considers both the operators’ failure to control their automated equipment and the industry regulator’s failure to ensure adequate monitoring of production activities. The Joint Accident Investigation commission of Estonia, Finland and Sweden’s report into the sinking of the MV Estonia is more than twice the length of the Cullen document (JAI, 1997). The scale and complexity of such documents imposes clear burdens upon the engineers, managers and operators who must understand their implications for the maintenance, development and running of many safety-critical systems. Recently, however, a number of regulatory authorities have begun to use the web as a primary means of disseminating accident reports. Electronic media are perceived to offer considerable support for the communication of these documents.
2. The Limitations of Existing Approaches to Web-Based Accident Reports
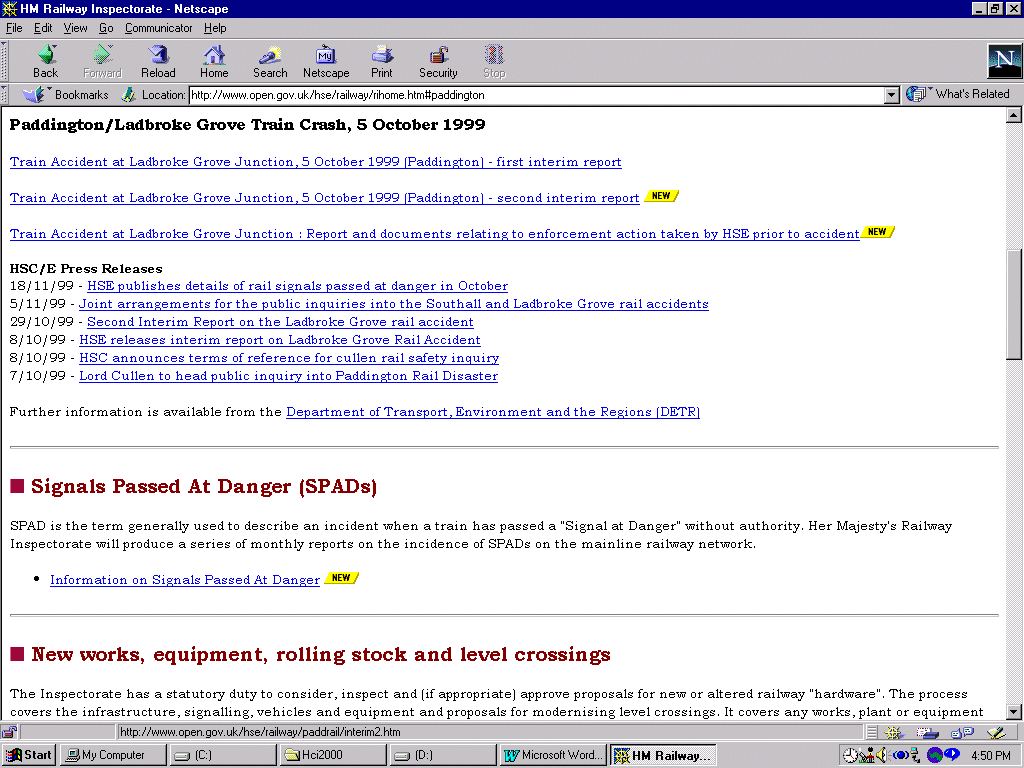
Two primary techniques have been used to support the electronic dissemination of accident reports. The first relies upon the Hypertext Mark-up Language (HTML). The latter relies upon Adobe’s proprietary Portable Display Format (PDF). The UK’s Health and Safety Executive site for the Ladbroke Grove rail crash typifies the HTML approach:
The user is presented with a series of hyperlinks. Figure 1 illustrates this approach. Once the user selects a particular report, they can read it in HTML format.

Figure 1: HTML Format of the Ladbroke Grove (Paddington) Accident Report
This use of the web offers a number of benefits for the dissemination of accident reports. It avoids the overheads of maintaining a catalogue of paper-based documents. No special software is needed to access HTML documents beyond a browser such as Netscape or Internet Explorer. The introduction of hyperlinks and on-line keyword search facilities also helps to reduce the navigation problems that frustrate the readers of paper-based documents. There are, however, a number of limitations. Previous research has identified both perceptual and cognitive problems associated with the on-screen reading of technical documents (O'Hara and Sellen, 1997). The improved comprehension that can be obtained through the appropriate use of hyperlinks as structuring tools can be jeopardised if on-line documents simply replicate the linear structure of paper based reports (Payne, Wenger and Cohen, 1993). It can take almost twice as long to read electronic copy (Muter and Maurutto, 1991). Readers are more prone to error when reading on-line documents (Wright and Lickorish, 1983). These problems are compounded by the difficulty of obtaining printed versions of the accident reports. Figures and photographs are often embedded as hypertext links in existing HTML reports. These will be missing in the printed version. Readers must manually piece together their hardcopy.
Many of these limitations can be avoided through the use of Adobe’s proprietary PDF. The US National Transportation Safety Board (NTSB) exploit this approach to the dissemination of accident reports:
Figure 2 presents an excerpt from a PDF report into a collision between an AMTRAK train and a Maryland Commuter service. The freely available PDF viewer integrates images and text to emulate the printed document on the screen. Readers can also obtain well-formatted, printed copies. This reduces the psychological and physiological problems of on-screen reading. However, these important benefits must be balanced against a number of problems. Firstly, it can be difficult for people to obtain and correctly install the most recent version of the PDF reader. This is important because these programmes are, typically, not a standard part of most browsers. Although PDF files are compressed, users can also experience significant delays in accessing these documents compared to HTML reports. Finally, it can be difficult to extract information once it has been encoded within a PDF document. This is a significant barrier if readers want to compile their own index of related incidents within an industry.
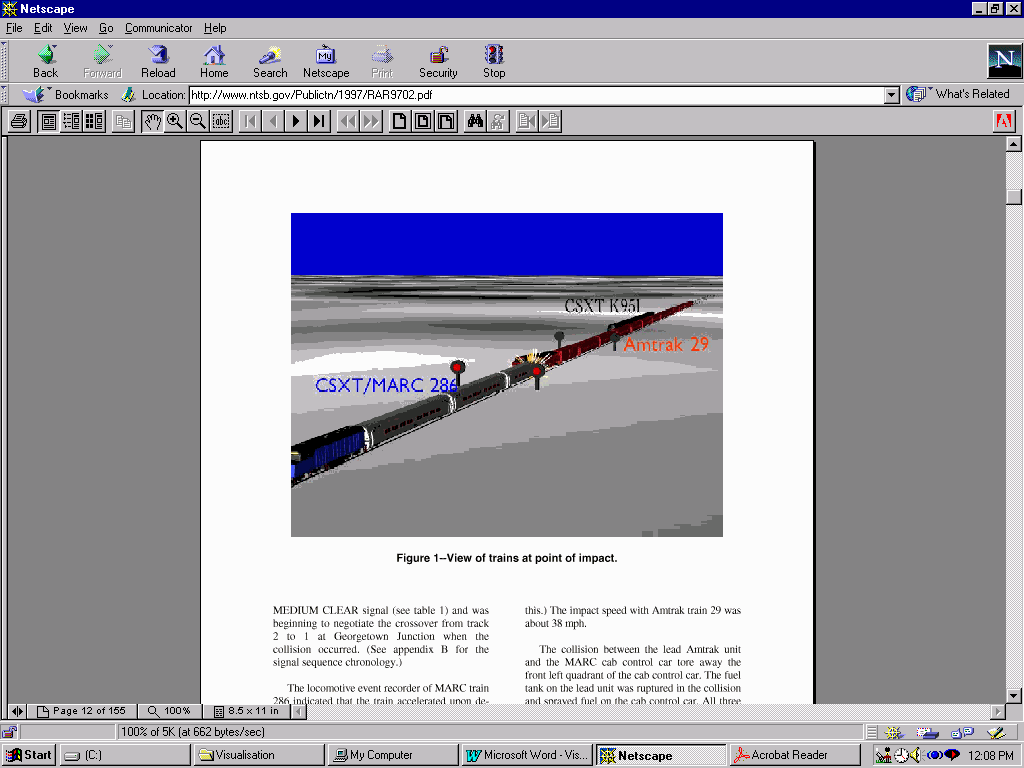
Figure 2: Using PDF to Support the Electronic Dissemination of Accident Reports
The previous paragraphs have argued that regulatory authorities are using the web to reduce the costs of providing access to printed accident reports. HTML and PDF are used to reproduce the linear document formats that have been exploited since the beginning of the twentieth century. This imposes significant burdens upon the reader and may fail to exploit the full potential of web based technology (Chalmers, Ingram, and Pfranger, 1996). The following sections, therefore, describe how visualisation techniques from other areas of human computer interaction can be used to communicate findings about operator error and system failure.
Any attempts to develop alternative visualisations of accident reports must be firmly grounded in the users’ requirements for these documents. We, therefore, conducted a prolonged survey to identify the perceived weaknesses of existing reporting techniques. It also helped to identify priorities for future presentation techniques (Snowdon and Johnson, 1999). The main finding of the requirements analysis was that readers face considerable problems in gaining a coherent overview of the events leading to human "error" and systems "failure" in existing paper-based and electronic accident reports.
3. Using Computer Simulations as an Interface to On-Line Accident Reports
One of the most effective means of providing an overview of the events leading to an accident is by simulation. It is surprising that this approach is not more widely integrated into the on-line presentation of accident reports. Simulations form a routine part of many accident investigations. For instance, Figure 2 shows how the NTSB’s PDF report uses a still image from a 3-D simulation to provide readers with an overview of the train collision. This simulation was undoubtedly available to accident investigators. It would have been relatively simple to provide access to other readers alongside the PDF report. Instead the reader has to piece together events from more than 40 pages of prose. The recent NTSB Board meeting that considered Schoolbus Accidents and Occupant Protection Systems provides a similar example. A large number of accident simulations were prepared for the board. Still images from these simulations are presented in Figure 3. These simulations have been "shot" from a number of viewpoints. They show both what an eyewitness might have seen but also what a "god’s eye" view can reveal about the wider course of events. They have not, however, been routinely integrated into the NTSB’s on-line accident reports.
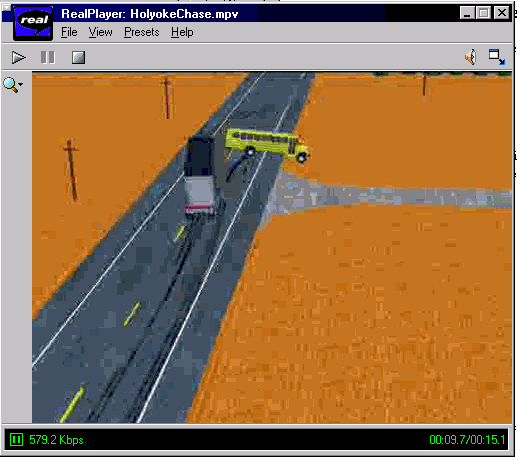
Figure 3: NTSB Board Simulation of the Holyoke Collision
In contrast, we have begun to use simulations as an interface to on-line accident reports. Users are presented with animations of the events leading to an accident. Their browser also simultaneously present a set of links to those sections of the existing report that deal with the stage of the accident that is currently being simulated. The links are automatically updated as the simulation progresses. Users can stop a simulation at any point during its execution. They can then use their browser to retrieve the relevant sections of the text-based report. Figure 4 illustrates two different applications of this approach. The system in 4 a) uses the scripting facilities in the Virtual Reality Mark-up Language (VRML) to generate a scale model for part of the Channel Tunnel. As can be seen, the Cosmo VRML helper application is fully integrated into the browser. The upper frame displays the links that refer to each moment in the simulation. Once selected these will replace the COSMO viewer with HTML or PDF excerpts from the official report. The approach in 4 b) exploits similar techniques but focuses on cockpit interaction during an air accident. A series of still images can be updated using the controls in the centre of the screen. On either side of the simulation are sections that present the transcripts both from the cockpit voice recorders and from the Air Traffic Controllers. The prose from the accident report is presented at the bottom of the screen. All sections of the interface are updated as the user moves through the simulation.
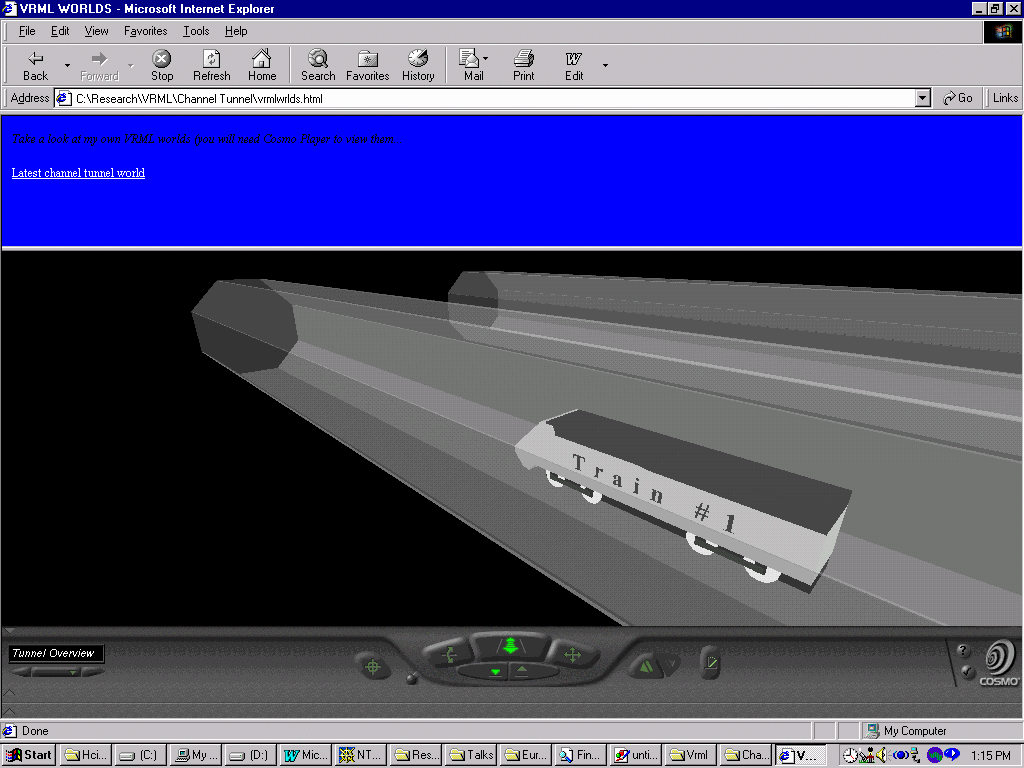
Figure 4 a): Using Simulations as the Interface to Accident Reports
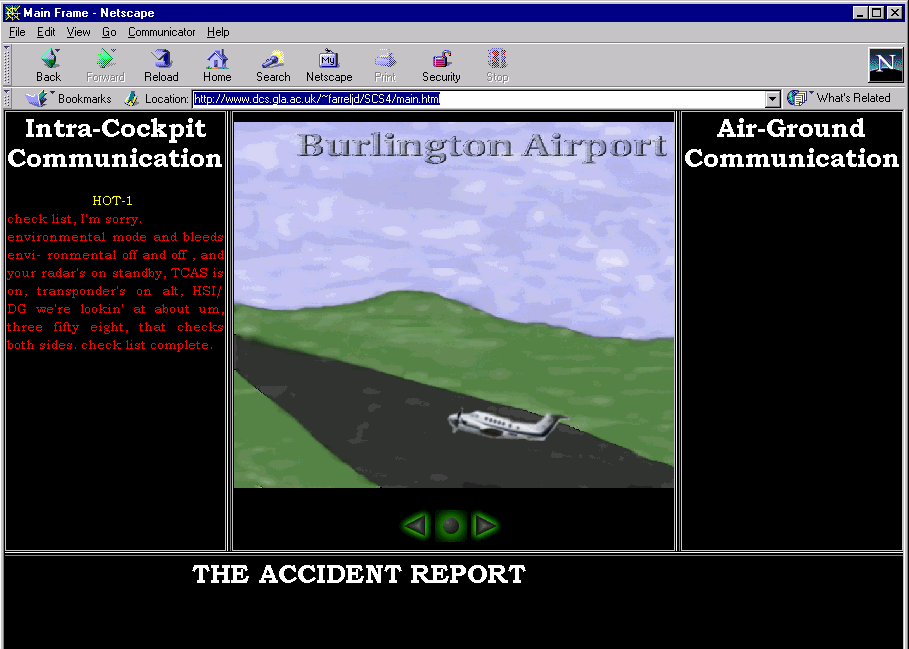
Figure 4 b): Using Simulations as the Interface to Accident Reports
Unfortunately, simulations cannot be used to support the presentation of all accident reports. For instance, the Clapham rail crash stemmed from a mistake during the wiring of a particular signal that occurred some time before the eventual collision. The wiring procedure could, of course, be simulated but it is difficult to see what the animation of such latent causes might contribute to the presentation of accident reports.
4. Using Timelines as an Interface to Accident Reports
The previous simulations attempted to provide a "faithful" recreation of the events leading to failure. It is also possible to exploit more abstract visualisations to provide readers with a better overview of the events leading to human error and systems failure (Love and Johnson, 1997). For example, Figure 5 uses a syntax that was proposed by the US Nuclear Regulatory Authority to create an accident fault tree. This diagram shows the events that contributed to the Clapham rail crash, mentioned above. Page numbers are provided for each component of the tree; users can rapidly index into the official paper-based accident report. More recently, we have extended this approach through the use of image maps. Rather than referring to page numbers, users simply select the appropriate area of the tree to be shown the corresponding sections of the on-line document. However, such representations quickly suffer from problems of scale. This is a significant limitation given the changes that have been identified in the scope and complexity of accident reports. A further technical limitation is that the accident fault tree shown in Figure 5 only has an implicit model of time. Events occurring towards the bottom of the diagram are assumed to take place before those immediately above them. This hardly captures the range of complex temporal properties that characterise human behaviour during many accidents.
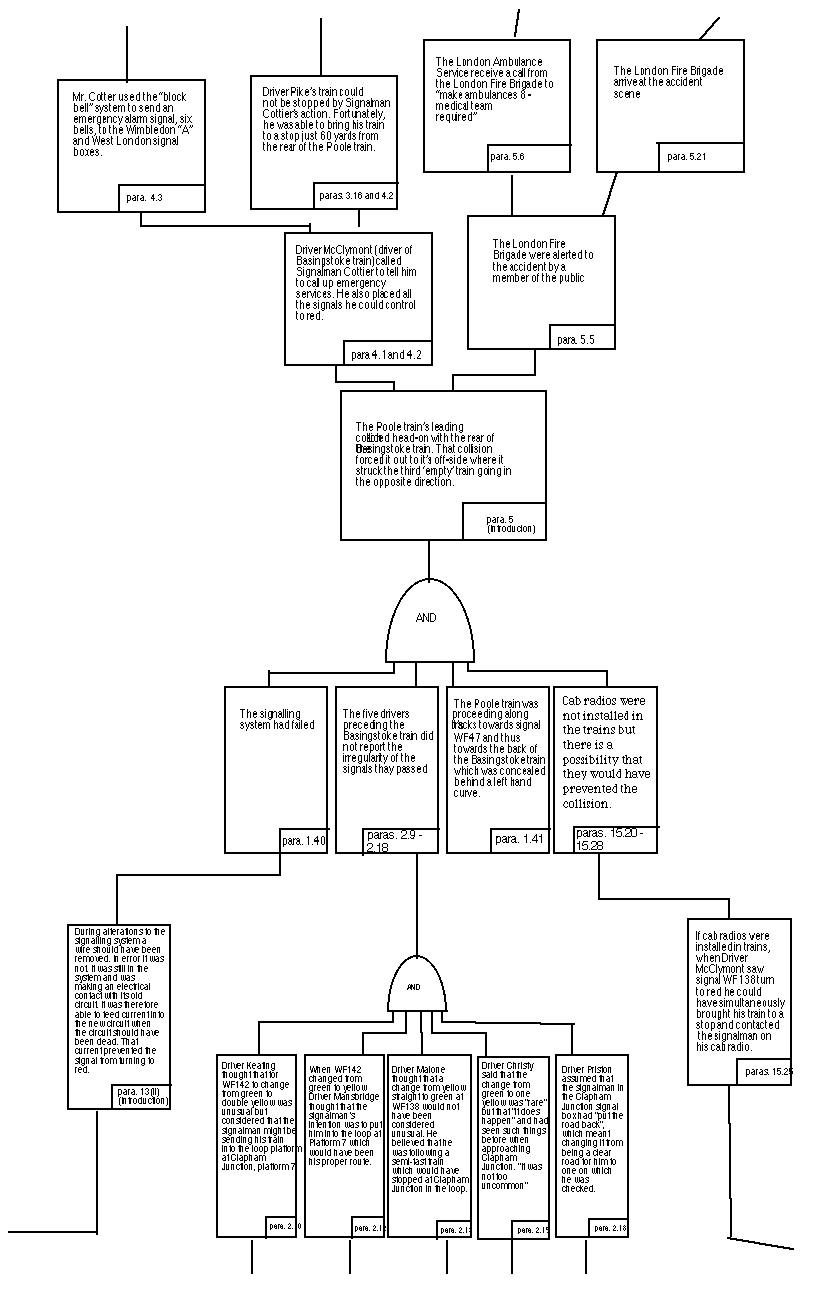
Figure 5: Accident Fault Tree for the Clapham Rail Crash
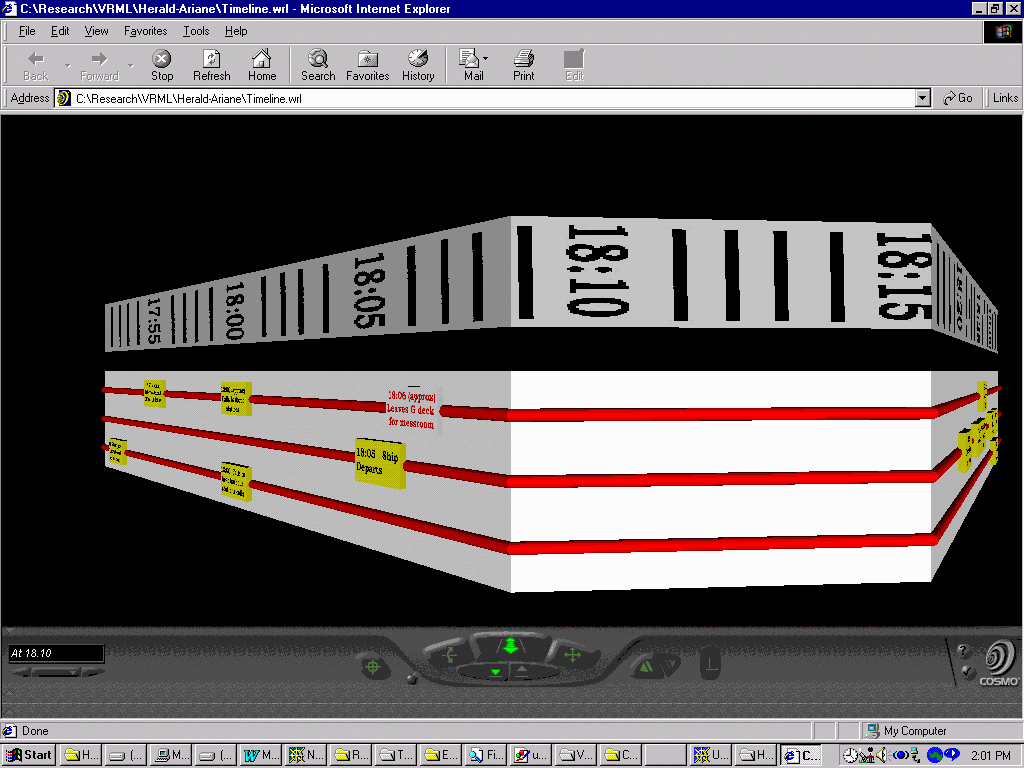
Figure 6 a): Using VRML Timelines as an Interface to Accident Reports
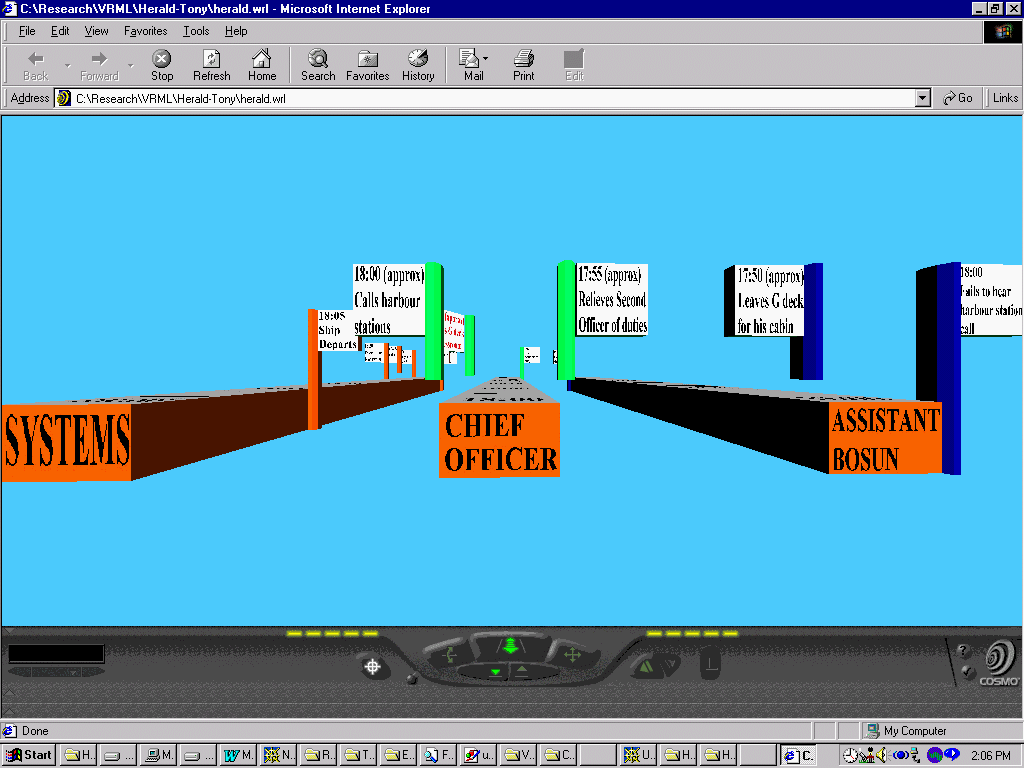
Figure 6 b): Using VRML Timelines as an Interface to Accident Reports
Figure 6 presents two approaches that use VRML technology as an interface to an accident report. The image 4a) applies Mackinlay, Robertson and Card’s (1991) work on the perspective wall. It provides an overview of the events leading to the capsize of the Herald of Free Enterprise. The intention behind this visualisation is to present particular details about the events in an accident without obscuring the context surrounding those details. In this case, the viewer can observe three surfaces that each contain information about three different phases of the accident: the initial events; the capsize and the rescue. The viewer can look closely at any single surface without obscuring the information on the other three surfaces. The horizontal bars that are embedded in the faces are used to distinguish system failures from organisational issues and operator "errors". The yellow blocks can be selected and, as before, will index into the Sheen report into the accident.
The image in 4b) constructs a three dimensional time line for the same accident report. Here the viewer can see a number of timelines that stretch from the start of the accident to the end. The navigational facilities of VRML viewers enable users to walk forward and backwards from any point during the accident. This enables them to see what occurred immediately before an event and also what happened in its aftermath. Each line represents the events that relate to particular agents involved in the accident. Here, the actions of the Chief Officer are distinguished from those of the Assistant Bosun. These, in turn, are distinguished from the behaviours associated with on-board systems. Rather than embedding blocks into a perspective wall, this visualisation uses flags to indicate information about particular events.
A considerable amount of additional analysis is required in order to generate both of the visualisations shown above. In contrast, we have developed interfaces that directly reflect the structure of a textual accident report. This approach is illustrated in Figure 7. A colour-coded index is presented on the left of the image. This refers to each of the bars on the three dimensional representation shown on the right hand side. The image on the right represents time advancing into the Z plane. Each bar, and therefore each colour in the index, relates to a chapter in the accident report. Links are drawn between any two bars that refer to the same instant in time during the accident. It is, therefore, possible to "walk" into the structure on the right to see whether different chapters treat the same events from slightly different perspectives. The lower area of the browser is used to present the electronic text of the accident report. Selecting a bar at any point in the Z plane will result in the image being updated to show any text relating to that moment in time in the selected chapter. This particular implementation provides access to the Organisation for Economic and Cultural Development’s Nuclear Energy Agency report into radiological and health impact of the Chernobyl accident. The top-most bar indicates that the initial action in shutting down the plant is referred to in the Executive Summary and the chapter entitled ‘The Release, Dispersion & Deposition of Radionuclides’.
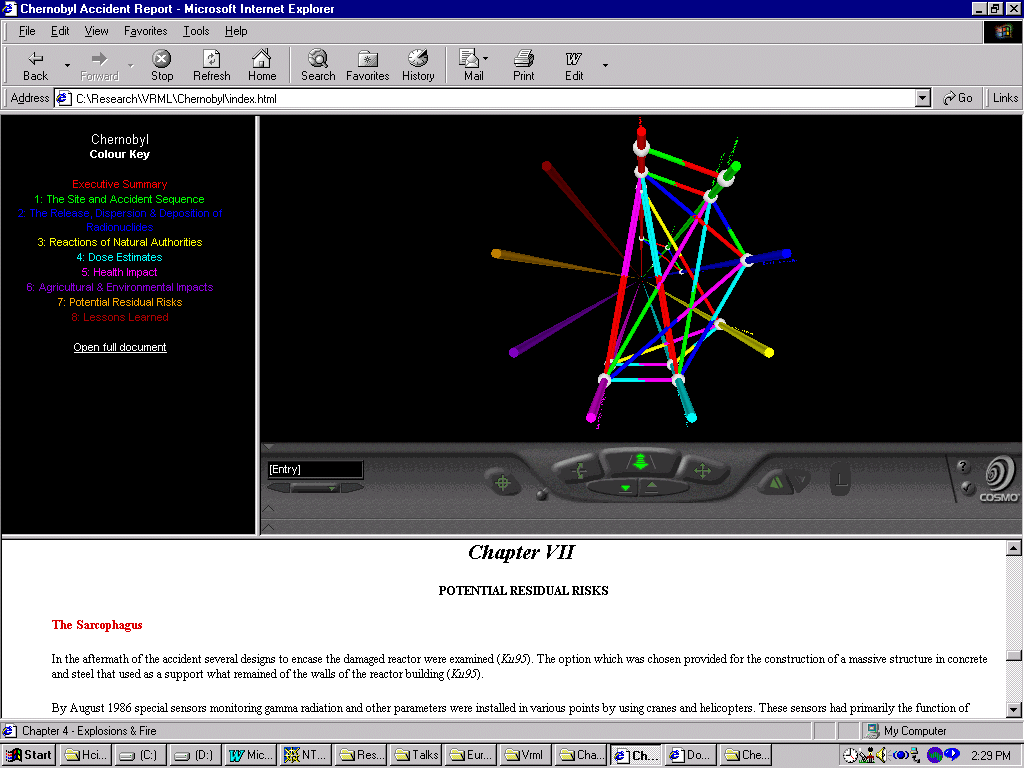
Figure 7: VRML Cross-referencing as an Interface to Accident Reports
5. Validation
The previous interfaces provide users with an overview of the events leading to major accidents (Snowdon and Johnson, 1999). A number of small-scale evaluations have been conducted to determine whether they satisfy this objective (Johnson, 1999a). For example, we have been able to show that the VRML timeline in Figure 6 leads to significantly reduced access times for retrieving particular items of information from an accident report. We have also been able to show that by using the timeline to familiarise themselves with the main events in the accident, users are able to provide more correct answers during comprehension tests (Johnson, 1998).
It is, however, important to identify two major caveats. The first significantly affects the usability of some of these interfaces. The second stems from the methodological problems that we have encountered during the validation of our visualisations:
Many users experienced considerable difficulty in moving along the three dimensional timelines shown in the previous section. This problem has been widely reported in previous work on the validation of desktopVR (Kaur Deol, Sutcliffe and Maiden, 1999). Several solutions have been proposed. For instance, recent versions of our software have made extensive use both of virtual way-points and of sign posts (Norris, Rashid and Wond, 1999). However, more needs to be done. It should also be noted that these navigation problems do not affect our use of accident simulations. The developer specifies the viewpoint and the sequence of events so that the reader need not navigate within a three dimensional environment. As noted, however, it is not possible to simulate all of the contributory factors leading to an accident.
DesktopVR interfaces and simulations, in general, have a strong subjective appeal (Johnson, 1998). This appeal can act as a strong motivating factor during initial trials. However, the attraction can quickly wane. Our initial evaluations have not been supported by longitudinal studies that might provide insights about the utility of these techniques for prolonged use.
These caveats raise significant questions about the long-term utility of many of our interfaces. However, the exact details of particular visualisations are less important than the meta-level concerns that motivate this paper. The existing use of HTML and PDF fails to provide users with the contextual information that they need in order to understand the causes of human "error" and systems "failure" (Snowdon and Johnson, 1999). We must urgently find novel solutions that address the expanding scope and complexity of recent accident reports. In particular, we must provide engineers, designers and managers with better overviews of the events leading to major failures.
6.Conclusions and Further Work
Accident reports describe the causes and consequences of human error and systems failure. They are intended to ensure that the weaknesses of previous applications are not propagated into future generations of interactive systems. They, therefore, have an important role to play in the development of safety critical interfaces. Existing paper-based reporting techniques have, however, remained relatively unchanged over the last century. During this time, the introduction of microprocessor technology has significantly increased the integration of heterogeneous processes. There have also been changes to the techniques that drive accident analysis. There is an increasing awareness that contextual and organisational issues must be considered in addition to any narrow findings about operator "error". The integration of safety-critical interfaces and the development of organisational approaches to accident analysis have created new challenges for the presentation of accident reports. The scope and complexity of these documents is increasing. Fortunately, most regulatory authorities have now begun to disseminate their accident reports over the World Wide Web. It is, therefore, possible to extend the application of advance visualisation and navigation techniques from other areas of HCI to support the readers of these critical documents. Unfortunately, most agencies focus on the Web as a means of dissemination rather than communication. Paper based reports are directly translated into HTML or Adobe’s PDF. This creates a number of usability problems. The HTML approach suffers from the well-known problems of reading large on-line documents. The PDF approach prevents many search engines from effectively retrieving information about similar accidents. This paper has, therefore, described a number of alternative approaches that support the presentation of accident reports. These interface more fully exploit the opportunities created by the electronic dissemination and communication of accident reports.
There is considerable scope for further work in this area. The paper has only presented initial attempts to address the problems that are being created by the electronic presentation of accident reports. For instance, we are currently using QuicktimeVR techniques to provide users with the ability to move within photo-realistic virtual representations of an accident location. This approach uses specialist tripods and interpolation software to stitch together a number of digital images. It has important benefits both during the presentation of accident reports and also during the investigative process. Investigators can use it to traverse and inspect the scene of an accident long after an incident has taken place. We are also using it as a familiarisation tool for juries. They can be shown the site of an accident without exposing themselves to the hazardous conditions that prevail in the aftermath of an accident.
This work raises a number of wider ethical and legal issues. There is a danger that virtual reality techniques, such as those presented in this paper, may provide a misleading view of what actually caused an accident. They rely entirely on the integrity of the people generating the simulation. The persuasiveness of three-dimensional simulations may convince users that they are watching a faithful representation of what actually occurred rather than the analyst’s interpretation of the events leading to an accident.
Acknowledgements
Thanks are due to the members of the Glasgow Accident Analysis Group and the Glasgow Interactive Systems group who provided valuable help and encouragement with this research. Particular thanks are due to the many students and research assistants who helped to design and build the visualisations that are presented in this paper. Douglas Melvin developed the Channel Tunnel simulation. Ariane Herbulot developed the perspective wall interface. Tony McGill developed the 3D timeline. Peter Hamilton produced the document web. James Farrel built the aviation simulation shown in Figure 5.
References
M. Chalmers, R. Ingram, C. Pfranger, Adding Imageability Features to Information Displays Papers: Information Visualization, Proceedings of the ACM Symposium on User Interface Software and Technology, p.33-39, 1996.
Cullen, Public Enquiry into the Piper Alpha Disaster, Department of Energy, Her Majesty’s Stationary Office, London, 1990.
A. Hale, B. Wilpert and M. Freitag, After the Event: From Accident to Organisational Learning, Pergamon Press, New York, 1997.
C.W. Johnson, On the Problems of Validating DesktopVR. In H. Johnson, L. Nigay and C. Roast (eds.) People and Computers XIII: Proceedings of HCI'98, Springer Verlag, London, United Kingdom, 326-338, 1998.
C.W. Johnson, Visualizing the Relationship between Human Error and Organisational Failure. In J. Dixon (ed.), Proceedings of the 17th International Systems Safety Conference, 101-110. The Systems Safety Society, Unionville, Virginia, United States of America, 1999.
C.W. Johnson, Evaluating the Contribution of DesktopVR for Safety-Critical Applications. In M. Felici, K. Kanoun and A. Pasquini (eds.), Computer Safety, Reliability and Security: Proceedings of 18th International Conference SAFECOMP'99, 67-78, Springer Verlag, 1999.
Joint Accident Investigation Commission of Estonia, Finland and Sweden, Final report on the Capsizing 28th September 1994 in the Baltic Sea of the Ro-Ro Ferry MV Estonia, Edita, Helsinki, 1997.
K. Kaur Deol, A. Sutcliffe and N. Maiden, Towards a Better Understanding of Usability Problems with Virtual Environments. In M. A. Sasse and C.W. Johnson (eds.) Interact’99, 544 551. IOS Press, Amsterdam, 1999.
L. Love and C.W. Johnson , Using Diagrams to Support the Analysis of System 'Failure' and Operator 'Error’. In H. Thimbleby and B. O'Conaill and P. Thomas (eds.), People and Computers XII: Proceedings of HCI'97, Springer Verlag, London, United Kingdom, 245-262, 1997.
J. D. Mackinlay, G. G. Robertson, Stuart K. Card, The Perspective Wall: Detail and Context Smoothly Integrated Information Visualisation, Proceedings of ACM CHI'91 Conference on Human Factors in Computing Systems, p.173-179, 1991.
P. Muter and P. Maurutto, Reading and Skimming from Computer Screens and Books: The Paperless Office Revisited? Simplifying Complex HCI Issues by Experiment, Behaviour and Information Technology, (10)4:257-266, 1991.
National Transportation Safety Board, Collision and Derailment of Maryland Rail Commuter MARC Train 286 and AMTRAK Train 29. RAR-97/0 2. Washington, USA, 1997.
B.E. Norris, D.Z. Rashid and B.L.W. Wong, Wayfinding/Navigation within a QTVR Virtual Environment. In M.A. Sasse and C.W. Johnson (eds.) Interact’99, 544 551. IOS Press, Amsterdam, 1999.
K. O'Hara and A. Sellen, A Comparison of Reading Paper and On-Line Documents PAPERS: Papers About Paper, Proceedings of ACM CHI 97 Conference on Human Factors in Computing Systems, p.335-342, 1997.
D. G. Payne, M. J. Wenger and M. S. Cohen, Cognitive Processing and Hypermedia Comprehension: A Preliminary Synthesis, Proceedings of the Fifth International Conference on Human-Computer Interaction, volume 2, 633-638, 1993.
C. Perrow, Normal Accidents: Living with High-Risk Technologies, Princeton University Press, Princeton, United States of America, 1999.
J.Reason, Managing the Risks of Organisational Accidents, Ashgate, Aldershot, UK, 1997.
P. Snowdon and C.W. Johnson, Results of a Preliminary Survey into the Usability of Accident and Incident Reports. In J. Noyes and M. Bransby (eds.), People in Control: An international conference on human interfaces in control rooms, cockpits and command centres, Bath, UK, 21-23 June 1999, 258-262, The Institute of Electrical Engineers, Savoy Place, London, United Kingdom, 1999.
P. Wright and A. Lickorish, Proof Reading Texts on Screen and Paper, Behaviour and Information Technology, (2)3:227-235, 1983.