Contents
synthquad.m
From A First Course in Machine Learning, Chapter 1. Simon Rogers, 31/10/11 [simon.rogers@glasgow.ac.uk]
clear all;close all;
Generate a synthetic dataset from a quadratic function
N = 200; %Number of data points
% Generate random x values between -5 and 5
x = 10*(sort(rand(N,1))-0.5);
Define the function and the true parameters
w_0 = 1;
w_1 = -2;
w_2 = 0.5;
Define t
t = w_0 + w_1*x + w_2*(x.^2);
Add some noise
t = t + 0.5*randn(N,1);
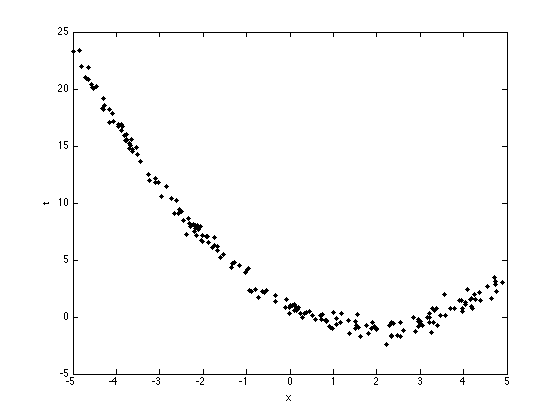
Plot the data
figure(1);
hold off
plot(x,t,'k.','markersize',10);
xlabel('x');
ylabel('t');
Fit the quadratic model and a linear model for comparison
Using vector matrix notation
X = [];
for k = 0:2
    X = [X x.^k];
    if k == 1
        linear_w = inv(X'*X)*X'*t;
    end
    if k == 2
        quad_w = inv(X'*X)*X'*t;
    end
end

fprintf('\n Linear function: t = %g + %g x',linear_w(1),linear_w(2));
fprintf('\n Quadratic function: t = %g + %g x + %g x^2',...
    quad_w(1),quad_w(2),quad_w(3));
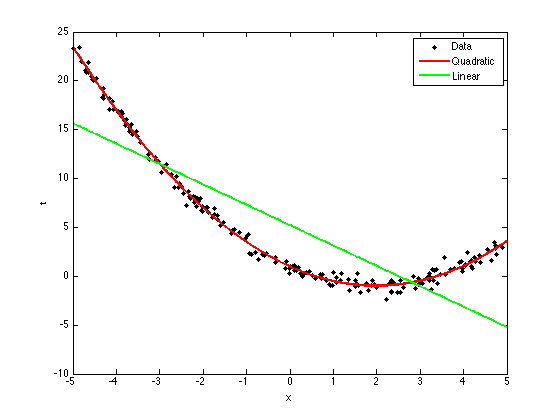
 Linear function: t = 5.20924 + -2.08484 x
 Quadratic function: t = 0.989651 + -1.98841 x + 0.501596 x^2
Plot the functions
plotx = [-5:0.01:5]';
plotX = [];
for k = 0:2
    plotX = [plotX plotx.^k];
end

figure(1);hold off;
% Add the data again
plot(x,t,'k.','markersize',10);
xlabel('x');
ylabel('t');
hold on
plot(plotx,plotX*quad_w,'r','linewidth',2);
plot(plotx,plotX(:,1:2)*linear_w,'g','linewidth',2);

legend('Data','Quadratic','Linear')