Contents
gauss_surf.m
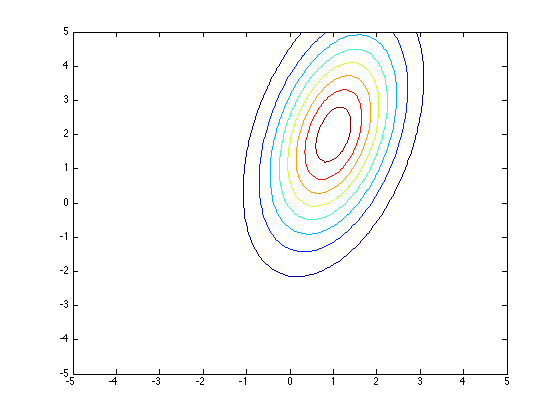
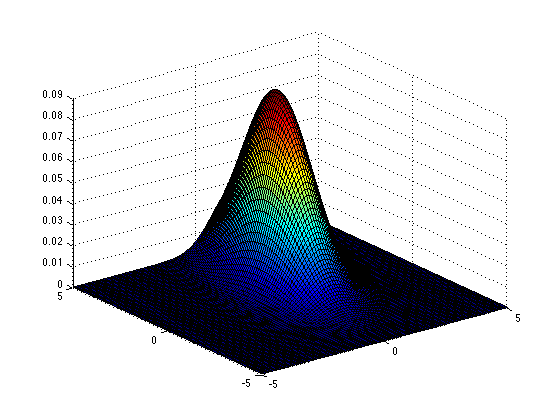
From A First Course in Machine Learning, Chapter 2. Simon Rogers, 01/11/11 [simon.rogers@glasgow.ac.uk] Surface and contour plots of a Gaussian
clear all;close all;
The Multi-variate Gaussian pdf is given by:

Define the Gaussian
mu = [1;2];
sigma = [1 0.8;0.8 4];
Define the grid for visualisation
[X,Y] = meshgrid(-5:0.1:5,-5:0.1:5);
Define the constant
const = (1/sqrt(2*pi))^2;
const = const./sqrt(det(sigma));
temp = [X(:)-mu(1) Y(:)-mu(2)];
pdfv = const*exp(-0.5*diag(temp*inv(sigma)*temp'));
pdfv = reshape(pdfv,size(X));
Make the plots
figure(1);hold off
contour(X,Y,pdfv);
figure(2);hold off
surf(X,Y,pdfv);