Contents
genolymp.m
From A First Course in Machine Learning, Chapter 2. Simon Rogers, 01/11/11 [simon.rogers@glasgow.ac.uk] Generative model for the Olympic data
clear all;close all;
Define the parameters - from previous exercises (see fitolymp.m)
w = [36.4165;-0.0133];
Load the Olympic data to get the Olympic years
load ../data/olympics
x = male100(:,1); % Olympic years
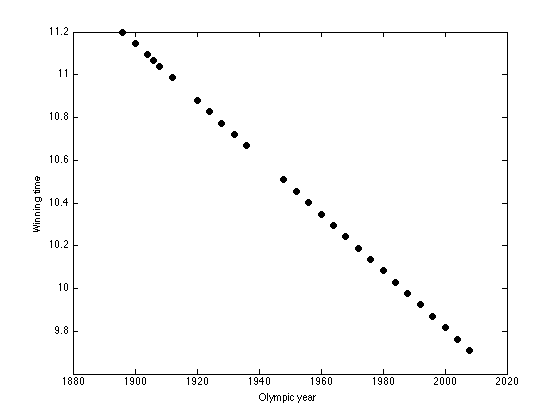
Compute the means from the model
X = [x.^0 x.^1];
mean_t = X*w;
Plot the means
figure(1);hold off
plot(x,mean_t,'ko','markersize',7,'markerfacecolor','k');
xlabel('Olympic year');
ylabel('Winning time');
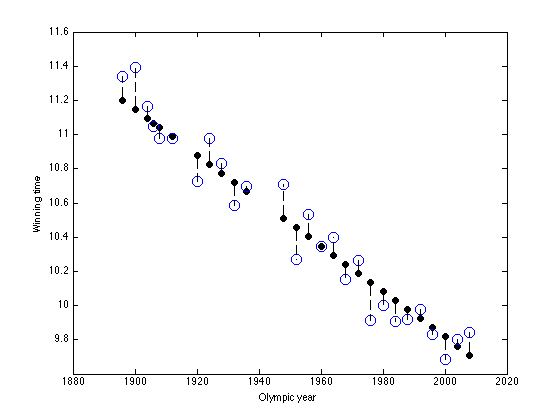
Generate some noise
noise_var = 0.01; % Vary this to change the noise level
noisy_t = mean_t + randn(size(mean_t)).*sqrt(noise_var);
Add these to the plot
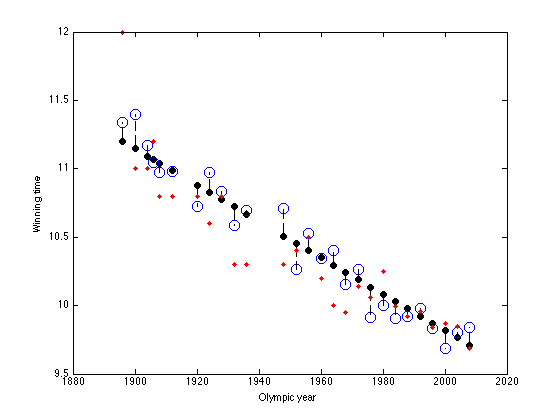
figure(1);hold on
plot(x,noisy_t,'bo','markersize',10);
% Draw lines between means and noise
for i = 1:length(x)
    plot([x(i) x(i)],[mean_t(i),noisy_t(i)],'k--');
end
Add the actual data as red dots, for comparison
plot(x,male100(:,2),'r.','markersize',10)