Contents
binmix.m
From A First Course in Machine Learning, Chapter 6. Simon Rogers, 01/11/11 [simon.rogers@glasgow.ac.uk] Mixture model for binary data
clear all;close all;
Generate the data
K = 5;
priors = repmat(1/K,1,K);
D = 10; %Number of dimensions
probs = rand(K,D); % The binary probabilities
N = 100; % The number of data objects

t = [];
for n = 1:N
    % Which component?
    pos = find(rand<cumsum(priors));
    t(n,1) = pos(1);
    for d = 1:D
        X(n,d) = (rand<probs(t(n,1),d));
    end
end

% Sort the data for visualisation
[t I] = sort(t);
X = X(I,:);
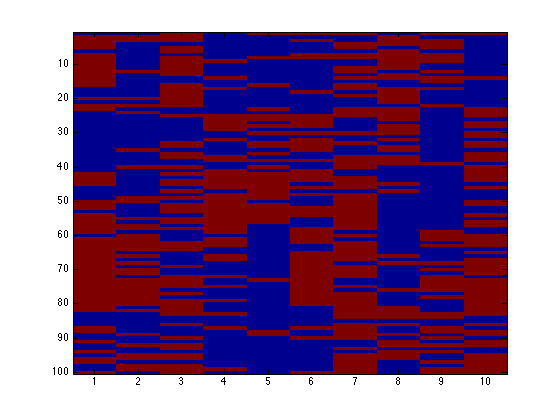
Image the data
figure(1);hold off
imagesc(X);
Run the mixture
K = 5; % Try changing this
B = [];
B(1) = -inf;
pkd = rand(K,D);
pri = repmat(1/K,1,K);
converged = 0;
it = 0;
tol = 1e-2;
MaxIts = 100;
alpha = 2;beta = 2; % MAP Smoothing parameters - set to 1 to turn off smoothing (may cause numerical instability)
while 1
    it = it + 1;

    % Update q
    temp = zeros(N,K);
    for k = 1:K
        temp(:,k) = sum(X.*log(repmat(pkd(k,:),N,1)) + ...
            (1-X).*log(repmat(1-pkd(k,:),N,1)),2);
    end
    temp = temp + repmat(log(pri),N,1);

    % Compute B
    if it>1
        B(it) = sum(sum(q.*log(repmat(priors,N,1)))) + ...
        sum(sum(q.*temp)) - ...
        sum(sum(q.*log(q)));
        % Prior contributions (due to smoothing)
        B(it) = B(it) + K*D*gammaln(alpha+beta) - ...
            K*D*gammaln(alpha) - K*D*gammaln(beta);
        B(it) + B(it) + (alpha-1)*sum(sum(log(pkd))) + ...
            (beta - 1)*sum(sum(log(1-pkd)));
        if abs(B(it)-B(it-1))<tol
            converged = 1;
        end
    end

    if converged == 1 || it>MaxIts
        break
    end

    q = exp(temp - repmat(max(temp,[],2),1,K));
    q = q./repmat(sum(q,2),1,K);


    % Update priors
    pri = mean(q,1);

    % Update probabilites
    for k = 1:K
        pkd(k,:) = (alpha - 1 + sum(repmat(q(:,k),1,D).*X,1))./(alpha + beta - 2 + sum(q(:,k)));
    end

end
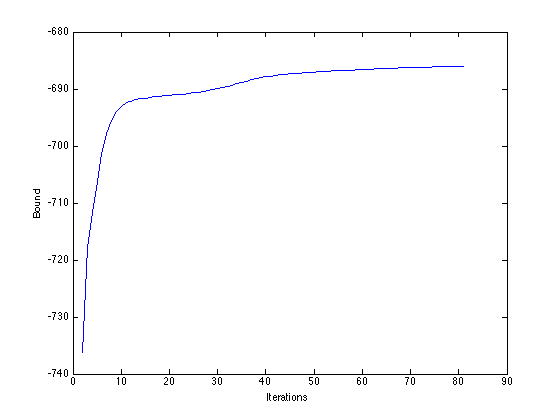
Plot the bound
figure(1); hold off
plot(B)
xlabel('Iterations');
ylabel('Bound');
Visualise the clusters
assi = (q==repmat(max(q,[],2),1,K));
for k = 1:K
    figure(k);hold off
    imagesc(X(assi(:,k),:));
    ti = sprintf('Cluster: %g',k);
    title(ti);
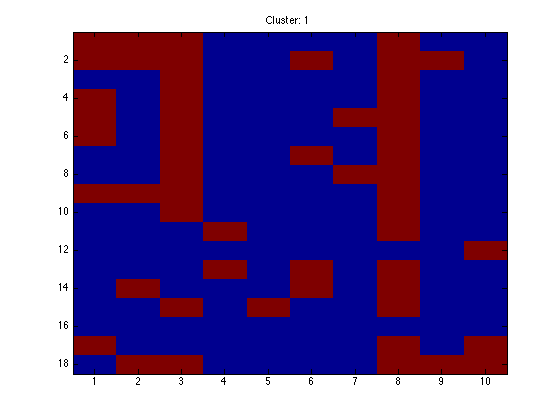
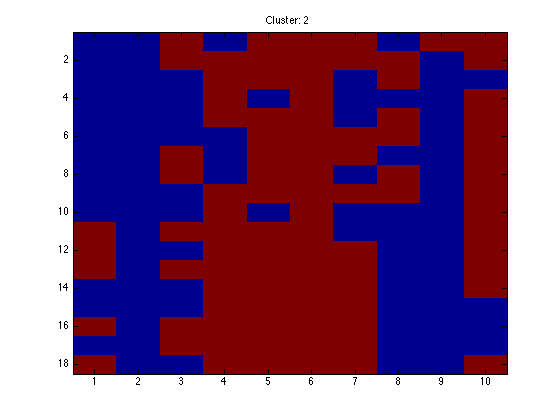
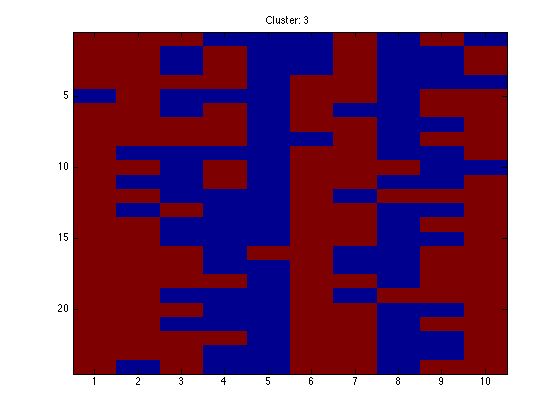
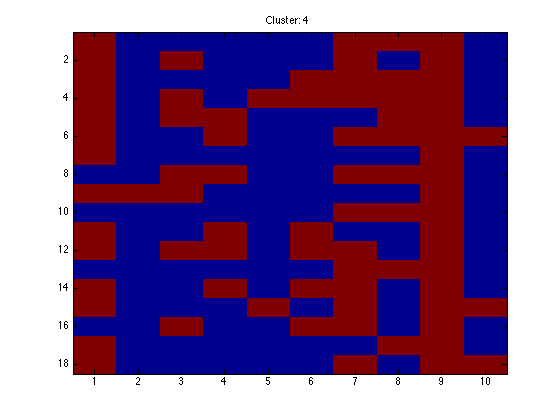
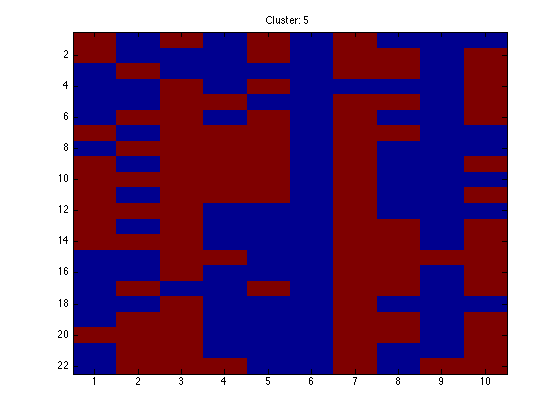
end
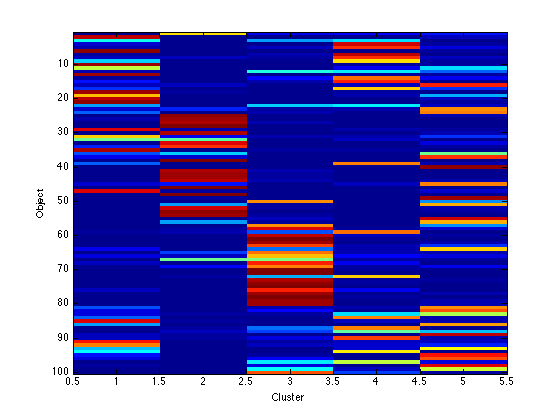
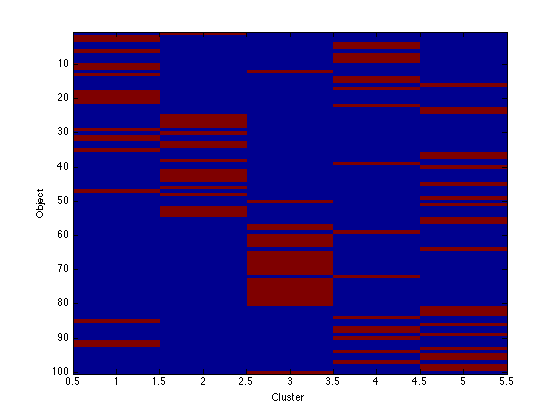
Image the q values
Note that because the data are in order, we should see clear block structure. It won't be perfect: our clusters were randomly generated so there is no gaurantee that they are particularly different.
figure(1);hold off
imagesc(q);
xlabel('Cluster');
ylabel('Object');
figure(2);hold off
imagesc(assi);
xlabel('Cluster');
ylabel('Object');