Contents
gmix.m
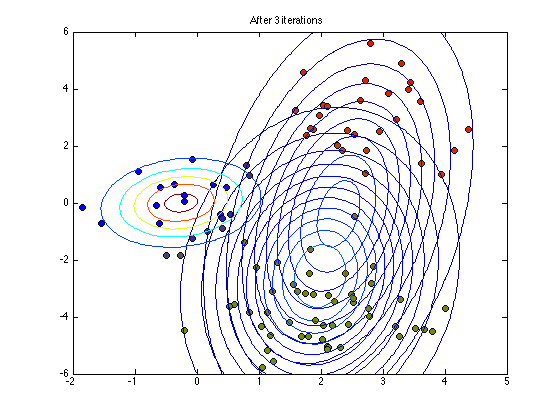
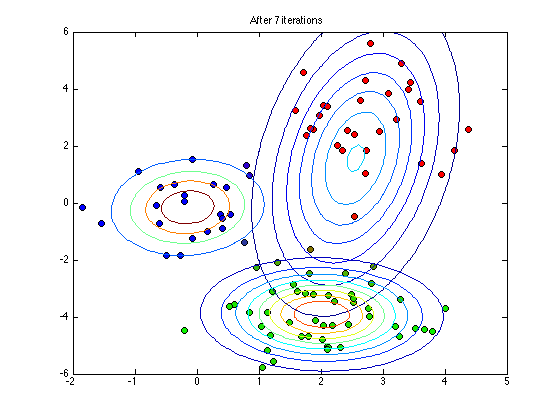
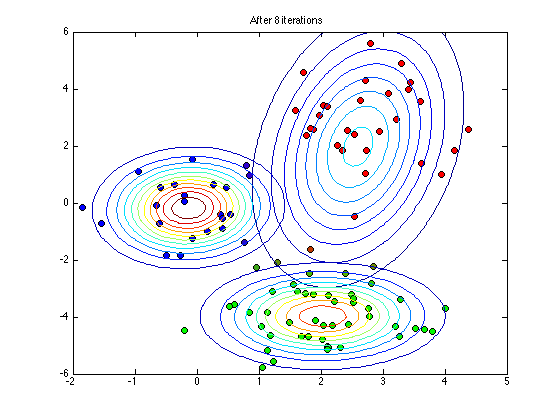
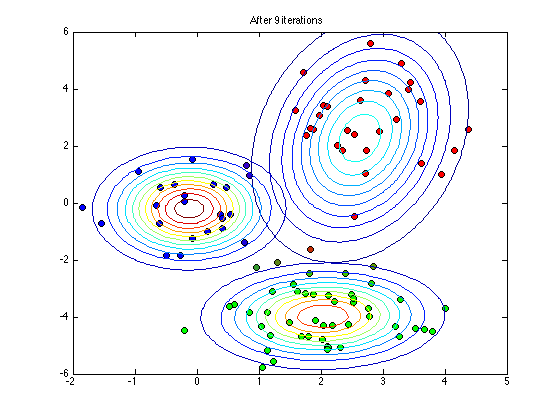
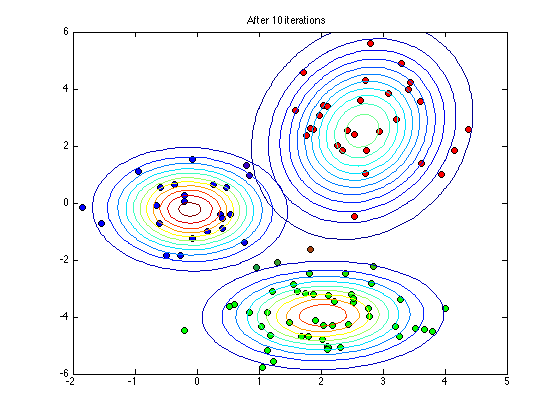
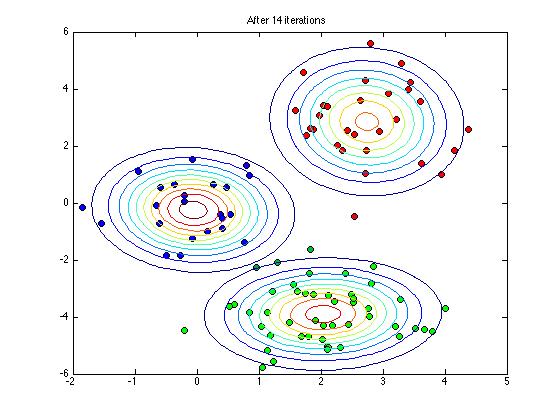
From A First Course in Machine Learning, Chapter 6. Simon Rogers, 01/11/11 [simon.rogers@glasgow.ac.uk] Fitting a Gaussian mixture
clear all;close all;
path(path,'../utilities');
Load the data
load ../data/kmeansdata
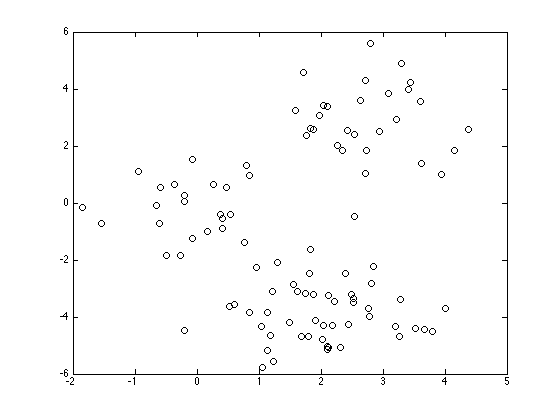
Plot the data
figure(1);hold off
plot(X(:,1),X(:,2),'ko');
Initilaise the mixture
K = 3; % Try changing this
means = randn(K,2);
for k = 1:K
    covs(:,:,k) = rand*eye(2);
end
priors = repmat(1/K,1,K);
Run the algorithm
MaxIts = 100;
N = size(X,1);
q = zeros(N,K);
D = size(X,2);
cols = {'r','g','b'};
plotpoints = [1:1:10,12:2:30 40 50];
B(1) = -inf;
converged = 0;
it = 0;
tol = 1e-2;
while 1
    it = it + 1;
    % Update q
    for k = 1:K
        const = -(D/2)*log(2*pi) - 0.5*log(det(covs(:,:,k)));
        Xm = X - repmat(means(k,:),N,1);
        temp(:,k) = const - 0.5 * diag(Xm*inv(covs(:,:,k))*Xm');
    end

    % Compute the Bound on the likelihood
    if it>1
        B(it) = sum(sum(q.*log(repmat(priors,N,1)))) + ...
            sum(sum(q.*temp)) - ...
            sum(sum(q.*log(q)));
        if abs(B(it)-B(it-1))<tol
            converged = 1;

        end
    end

    if converged == 1 || it>MaxIts
        break
    end

    temp = temp + repmat(priors,N,1);

    q = exp(temp - repmat(max(temp,[],2),1,K));
    % Minor hack for numerical issues - stops the code crashing when
    % clusters are empty
    q(q<1e-60) = 1e-60;
    q(q>1-1e-60) = 1e-60;
    q = q./repmat(sum(q,2),1,K);
    % Update priors
    priors = mean(q,1);
    % Update means
    for k = 1:K
        means(k,:) = sum(X.*repmat(q(:,k),1,D),1)./sum(q(:,k));
    end
    % update covariances
    for k = 1:K
        Xm = X - repmat(means(k,:),N,1);
        covs(:,:,k) = (Xm.*repmat(q(:,k),1,D))'*Xm;
        covs(:,:,k) = covs(:,:,k)./sum(q(:,k));
    end
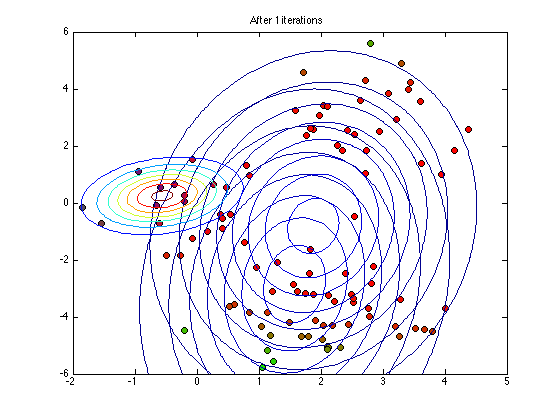
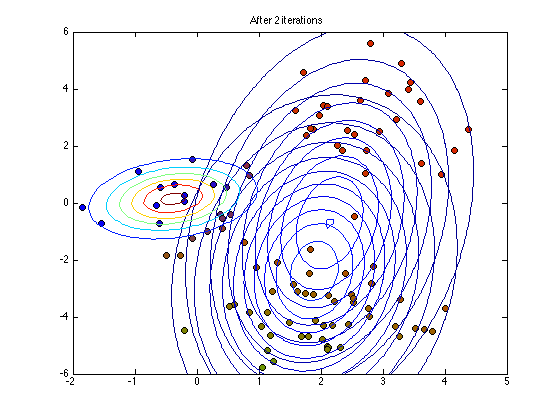
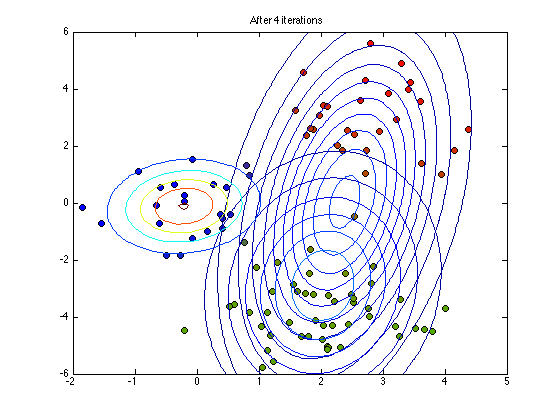
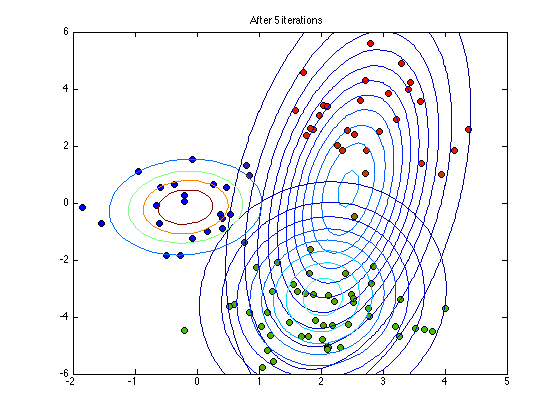
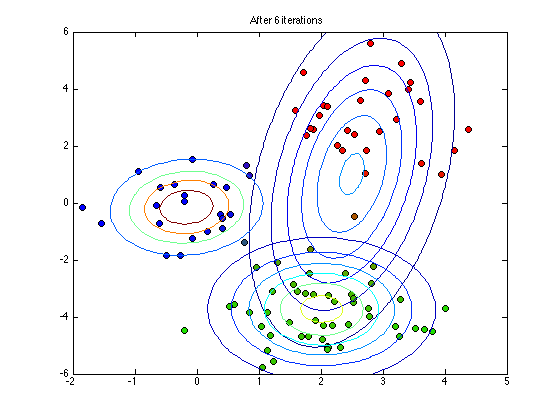
Plot the current status
    if any(it==plotpoints)
        figure(1);hold off
        % Note the following plots points using q as their RGB colour value
        for n = 1:N
            plot(X(n,1),X(n,2),'ko','markerfacecolor',q(n,:));
            hold on
        end
        for k = 1:K
            plot_2D_gauss(means(k,:),covs(:,:,k),...
                -2:0.1:6,-6:0.1:6);
        end
        ti = sprintf('After %g iterations',it);
        title(ti)
    end

end
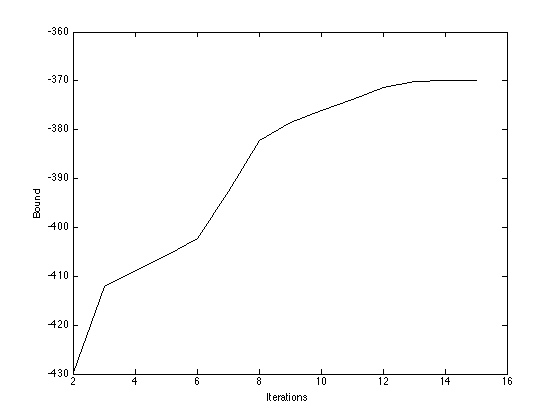
Plot the bound
figure(1);hold off
plot(2:length(B),B(2:end),'k');
xlabel('Iterations');
ylabel('Bound');