Contents
mpvis.m
From A First Course in Machine Learning, Chapter 6. Simon Rogers, 01/11/11 [simon.rogers@glasgow.ac.uk] Visualising the MP data
clear all;close all;

load ../data/parliament1997;
Firstly, do standard PCA
Y = X';
Y = Y - repmat(mean(Y,1),size(Y,1),1);
N = size(Y,1);
C = (1/N)*Y'*Y;
[w,lam] = eigs(C);
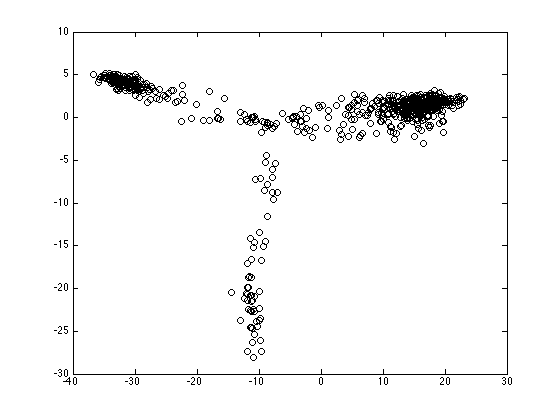
Plot the projections
figure(1);hold off
proj = Y*w(:,1:2);
plot(proj(:,1),proj(:,2),'ko')
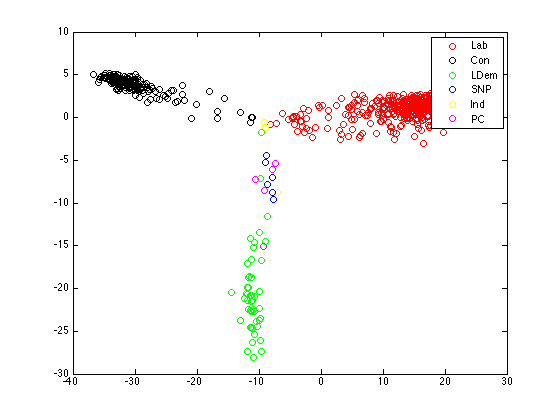
Plot the projections, coloured by parties
cols = {'ro','ko','go','bo','yo','mo'};
pa = {'Lab','Con','LDem','SNP','Ind','PC'};
figure(1);hold off
for i = 1:length(pa)
    pos = find(strcmp(pa{i},party));
    plot(proj(pos,1),proj(pos,2),cols{i});
    hold on
end
legend(pa);
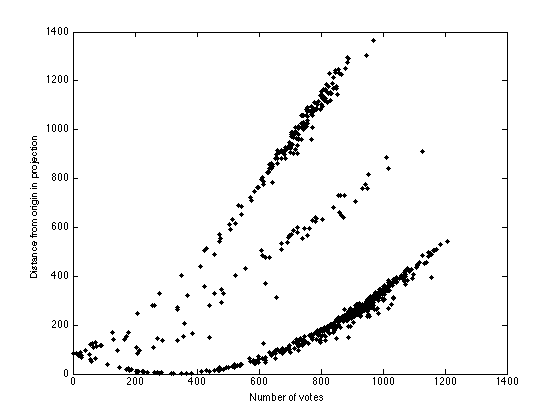
Plot number of votes versus distance from origin
s = sum(X'~=0,2);
di = sum(proj.^2,2);
figure(1);hold off
plot(s,di,'k.','markersize',10);
xlabel('Number of votes');
ylabel('Distance from origin in projection');
Use the variational probit algorithm
load ../data/parliament1997;
Y = X';
D = 2; % Dimensionality of projection
Z = (Y~=0); % Location of values
[N,M] = size(Y);
X = randn(N,D)*0.01;
W = randn(M,D)*0.01;
Q = zeros(N,M);
a = repmat(-1e6,size(Q));
b = repmat(1e6,size(Q));
a(Y==1) = 0;
b(Y==-1) = 0;

xxt = zeros(D,D,N);
for n = 1:N
    xxt(:,:,n) = X(n,:)'*X(n,:);
end


MaxIts = 100;
for it = 1:MaxIts
    if rem(it,10)==0
        fprintf('\nIt: %g',it);
    end
    % Update q
    xw = X*W';
    ai = (a-xw);
    bi = (b-xw);
    Q = xw + ((normpdf(ai)-normpdf(bi))./(normcdf(bi)-normcdf(ai)));
    wdet = 0; wsum = 0;
    for m = 1:M
        temp = eye(D)+sum(xxt.*repmat(reshape(Z(:,m),[1,1,N]),...
            [D,D,1]),3);
        covw(:,:,m) = inv(temp);
        W(m,:) = covw(:,:,m)*sum(X.*repmat(Z(:,m).*(Q(:,m)),[1,D]),1)';
        wwt(:,:,m) = covw(:,:,m) + W(m,:)'*W(m,:);
    end


    xdet = 0;
    xsum = 0;
    xwwx = 0;
    otherbit = 0;
    for n = 1:N
        temp = eye(D)+sum(wwt.*repmat(reshape(Z(n,:),[1,1,M])...
            ,[D,D,1]),3);
        covx(:,:,n) = inv(temp);
        X(n,:) = covx(:,:,n)*sum(W'.*repmat(Z(n,:).*(Q(n,:)),[D,1]),2);
        xxt(:,:,n) = covx(:,:,n) + X(n,:)'*X(n,:);
    end
end
It: 10
It: 20
It: 30
It: 40
It: 50
It: 60
It: 70
It: 80
It: 90
It: 100
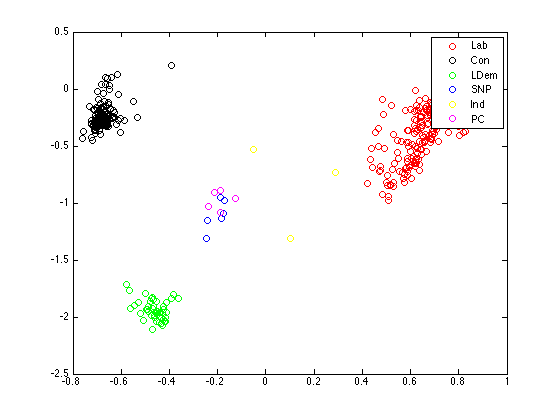
Plot the projections, coloured by parties
cols = {'ro','ko','go','bo','yo','mo'};
pa = {'Lab','Con','LDem','SNP','Ind','PC'};
figure(1);hold off
for i = 1:length(pa)
    pos = find(strcmp(pa{i},party));
    plot(X(pos,1),X(pos,2),cols{i});
    hold on
end
legend(pa);
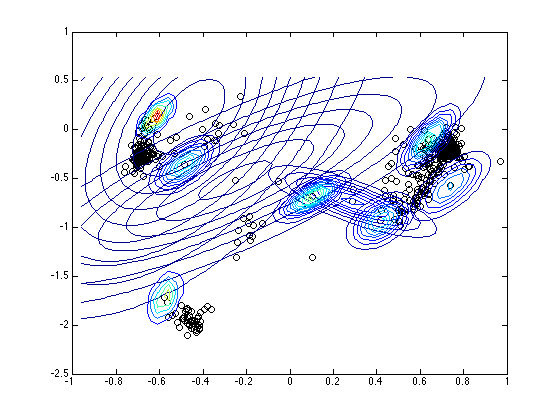
Plot the projections with the ten most variable MPs
path(path,'../utilities');
figure(1);hold off
plot(X(:,1),X(:,2),'ko')
hold on
detc = [];
for n = 1:N
    detc(n) = det(covx(:,:,n));
end
[detc I] = sort(detc,'descend');
xr = min(X(:,1))-0.2:0.05:max(X(:,1))+0.2;
yr = min(X(:,2))-0.2:0.05:max(X(:,2))+0.2;
for n = 1:10
    pos = I(n);
    plot_2D_gauss(X(pos,:),covx(:,:,pos),xr,yr);
end
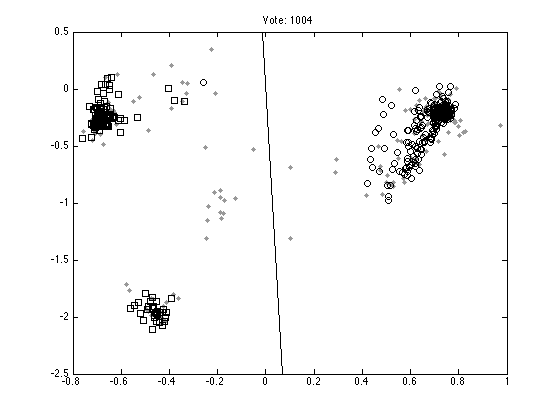
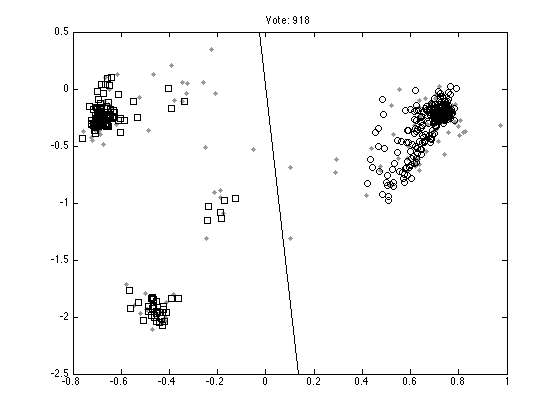
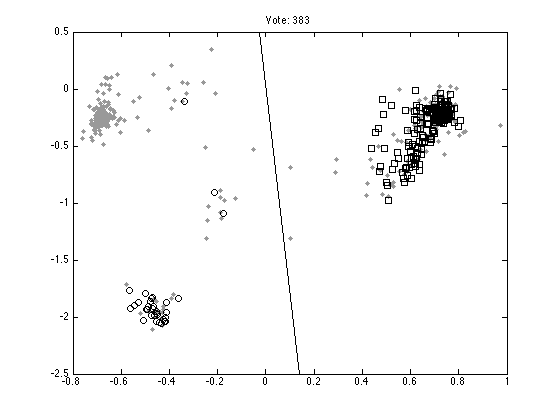
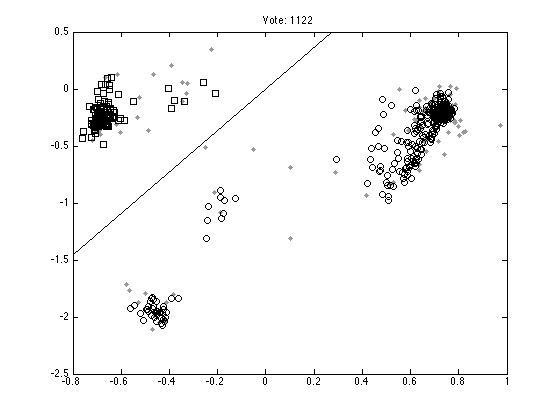
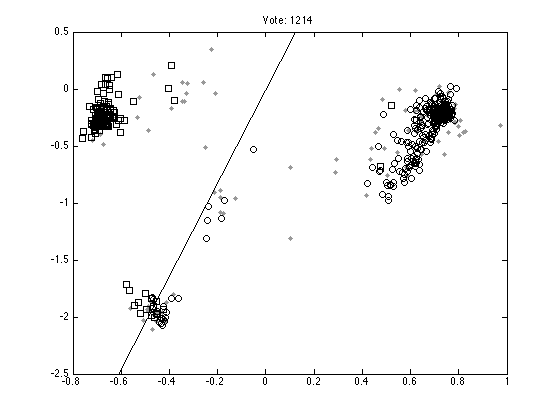
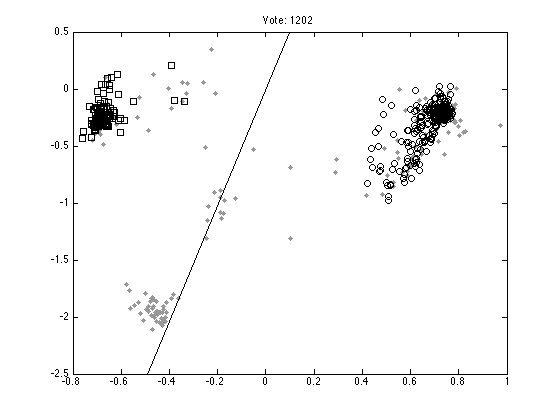
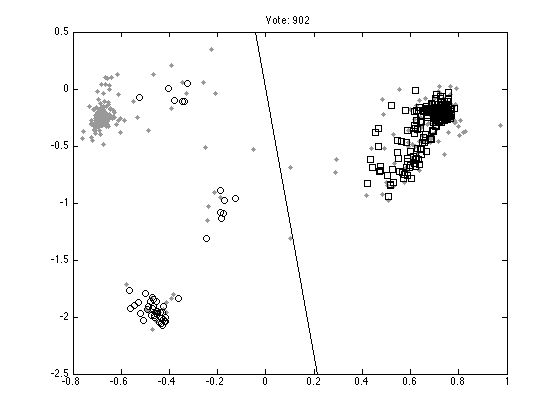
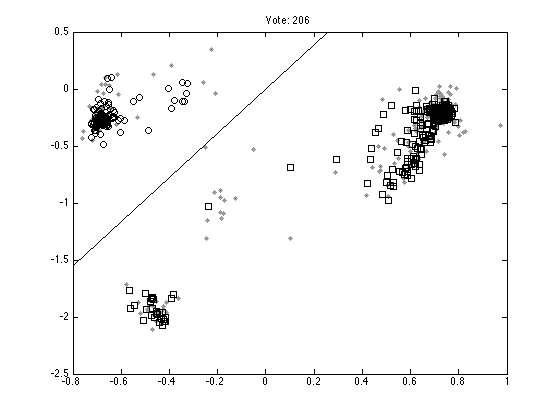
Plot ten random votes
order = randperm(M);
for n = 1:10
    vote = order(n);
    figure(n);hold off
    % Those that don't vote
    pos = find(Y(:,vote)==0);
    plot(X(pos,1),X(pos,2),'k.','color',[0.6 0.6 0.6],'markersize',10);
    hold on
    % Those that vote 1
    pos = find(Y(:,vote)==1);
    plot(X(pos,1),X(pos,2),'ks');
    % Those that vote -1
    pos = find(Y(:,vote)==-1);
    plot(X(pos,1),X(pos,2),'ko');
    xl = xlim;
    yl = ylim;
    plot(xl,-xl*W(vote,1)/W(vote,2),'k');
    ylim(yl);
    ti = sprintf('Vote: %g',vote);
    title(ti);
end