abc.m
Approximate Bayesian Computation
From A First Course in Machine Learning Simon Rogers, August 2016 [simon.rogers@glasgow.ac.uk]
Contents
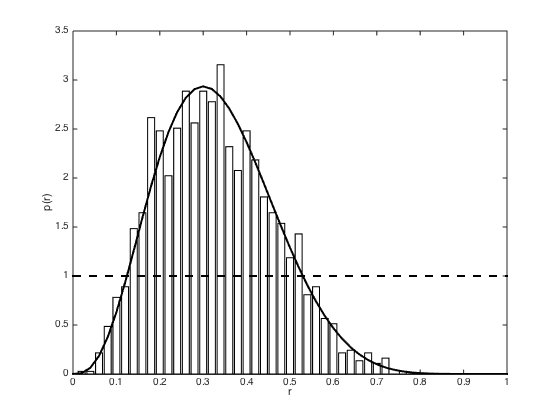
Start with an exact posterior from the coin game
Assume we have observed 3 heads in 10 tosses
clear all;close all
p = 0.3; % true value
N = 10;
n_success = 3;


% Define the prior
alpha = 1;beta = 1;

accepted = [];

S = 20000;

% Do the sampling
for s = 1:S
    proposed_p = betarnd(alpha,beta);
    proposed_success = sum(rand(1,N)<proposed_p);
    if proposed_success == n_success
        accepted(end+1) = proposed_p;
    end
end

% Compute some statistics and plot the true distribution with the samples
% (and the prior - dashed)
efficiency = length(accepted)/S;
b = [0:0.02:1];
[a,b] = hist(accepted,b);
b_diff = b(2)-b(1);
a = a./sum(a);
a = a./b_diff;
figure(1);
hold off
bar(b,a,'facecolor',[1 1 1]);
hold on
plot(b,betapdf(b,alpha+n_success,beta+N-n_success),'k','linewidth',2)
plot(b,betapdf(b,alpha,beta),'k--','linewidth',2)
xlim([0 1])
xlabel('r')
ylabel('p(r)')
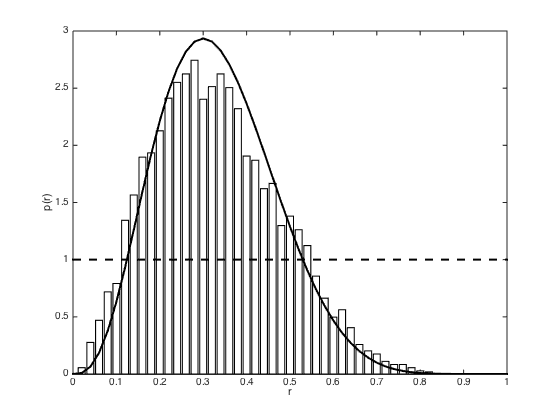
Now make it a bit 'approximate'
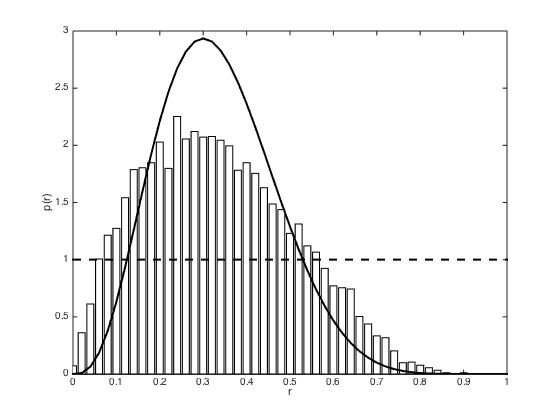
Samples are acceptec if they have an error of less than or equal to 1 or 2 (i.e. 2,3,4 successes will all be accepted or 1,2,3,4,5)
clear all;close all
p = 0.3; % true value
N = 10;
n_success = 3;

for error = 1:2
    % Define prior as before
    alpha = 1;beta = 1;

    accepted = [];

    S = 20000;

    for s = 1:S
        proposed_p = betarnd(alpha,beta);
        proposed_success = sum(rand(1,N)<proposed_p);
        if abs(proposed_success - n_success)<=error
            accepted(end+1) = proposed_p;
        end
    end
    % Compute some stats
    efficiency = length(accepted)/S
    b = [0:0.02:1];
    [a,b] = hist(accepted,b);
    b_diff = b(2)-b(1);
    a = a./sum(a);
    a = a./b_diff;
    figure();
    hold off
    bar(b,a,'facecolor',[1 1 1]);
    hold on
    plot(b,betapdf(b,alpha+n_success,beta+N-n_success),'k','linewidth',2)
    plot(b,betapdf(b,alpha,beta),'k--','linewidth',2)
    xlim([0 1])
    xlabel('r')
    ylabel('p(r)')
end
efficiency =

    0.2715


efficiency =

    0.4573
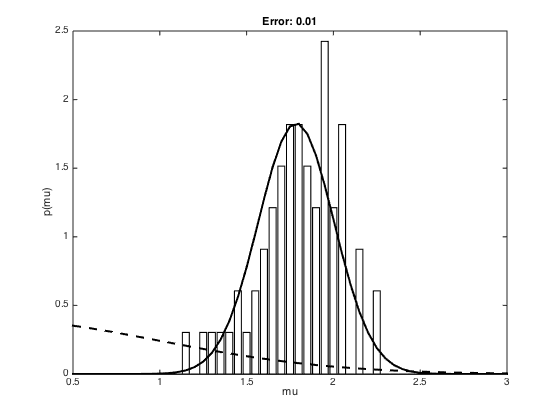
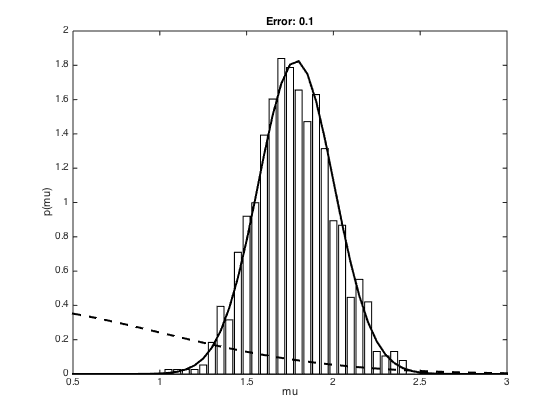
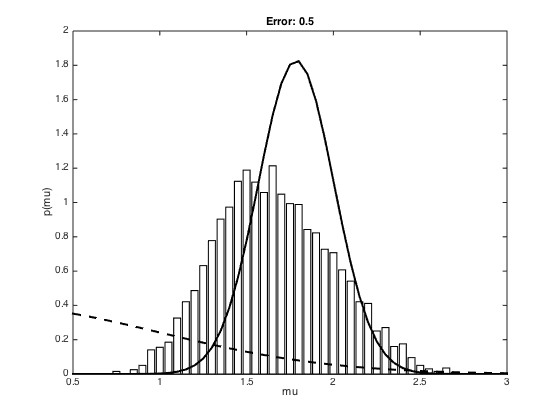
Now use ABC for a Gaussian
Define the Gaussian parameters
true_mu = 2;
ss = 1;
% Draw N samples
N = 20;
x = randn(N,1).*sqrt(ss)+true_mu;
mu = mean(x);
max_errors = [1e-2,1e-1,5e-1];
efficiency = {};
for me = 1:length(max_errors)
    max_error = max_errors(me);
    mu0 = 0;
    ss0 = 1;
    S = 50000;
    accepted = [];
    for s = 1:S
        % Sample a mu from the prior
        proposed_mu = randn.*sqrt(ss0)+mu0;
        % Sample some data
        proposed_x = randn(N,1)+proposed_mu;
        % Ciompute the data mean and compare to the sample mean
        d_mu = mean(proposed_x);
        if abs(d_mu-mu) < max_error
            accepted(end+1) = proposed_mu;
        end
    end

    % Compute some stats and plot
    efficiency{me} = 100*length(accepted)/S;
    m = [0.5:0.05:3];
    post_ss = 1/(1/ss0 + N/ss);
    post_mu = post_ss*(mu0/ss0 + (1/ss)*sum(x));
    [a,b] = hist(accepted,m);
    a = a./sum(a);
    a = a./(b(2)-b(1));
    figure();
    bar(b,a,'facecolor',[1 1 1])
    hold on
    plot(m,normpdf(m,post_mu,sqrt(post_ss)),'k','linewidth',2)
    plot(m,normpdf(m,0,1),'k--','linewidth',2)
    xlim([0.5 3])
    xlabel('mu')
    ylabel('p(mu)')
    title(sprintf('Error: %g',max_error));
end