gp_smc.m
Sequential Monte-Carlo. GP classification
From A First Course in Machine Learning Simon Rogers, August 2016 [simon.rogers@glasgow.ac.uk]
Contents
Generate some data and create the covariance matrices
clear all;
close all;
rng(222)
x = sort(rand(10,1));
t = [repmat(0,5,1);repmat(1,5,1)];
N = length(x);
testx = [0:0.01:1]';
Ntest = length(testx);
gamma = 10.0;alpha = 1;
C = zeros(N);
testC = zeros(N,Ntest);
for n = 1:N
    for m = 1:N
        C(n,m) = alpha*exp(-gamma*(x(n)-x(m))^2);
    end
    for m = 1:Ntest
        testC(n,m) = alpha*exp(-gamma*(x(n) - testx(m))^2);
    end
end
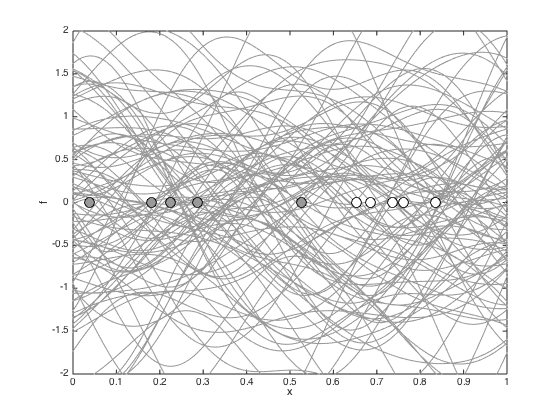
Generate 100 samples from the prior
n_samps = 100;
f_samp = mvnrnd(repmat(0,N,1),C,n_samps);
f_samp_test = zeros(n_samps,Ntest);
Ci= inv(C);
for s = 1:n_samps
    f_samp_test(s,:) = (testC'*Ci*f_samp(s,:)')';
end
figure();hold off
plot(testx,f_samp_test','k','color',[0.6 0.6 0.6])
hold on
pos = find(t==0);
plot(x(pos),zeros(size(x(pos))),'ko','markerfacecolor',[0.6 0.6 0.6],'markersize',10);
hold on
pos = find(t==1);
plot(x(pos),zeros(size(x(pos))),'ko','markerfacecolor',[1 1 1],'markersize',10);
ylim([-2,2]);
xlabel('x');
ylabel('f');
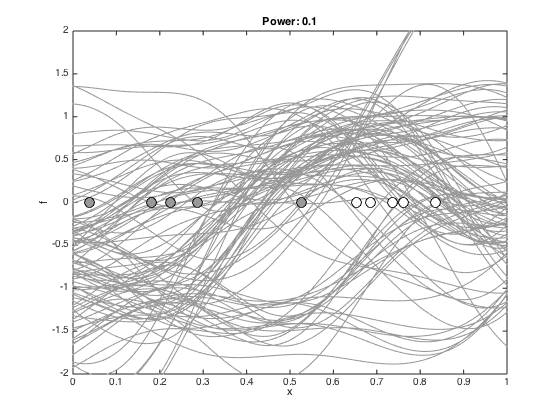
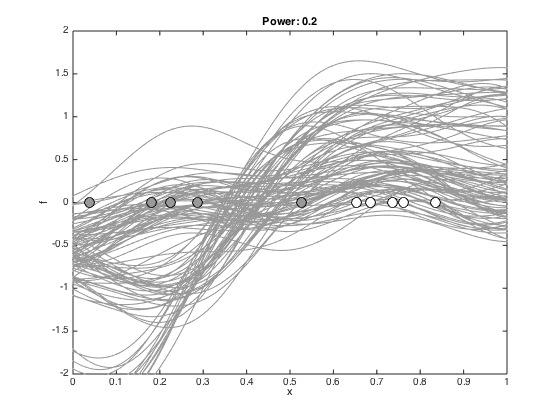
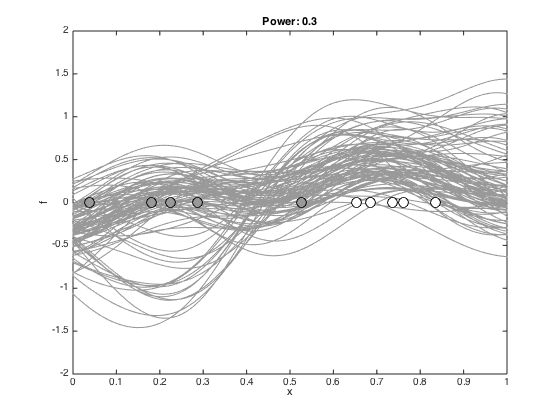
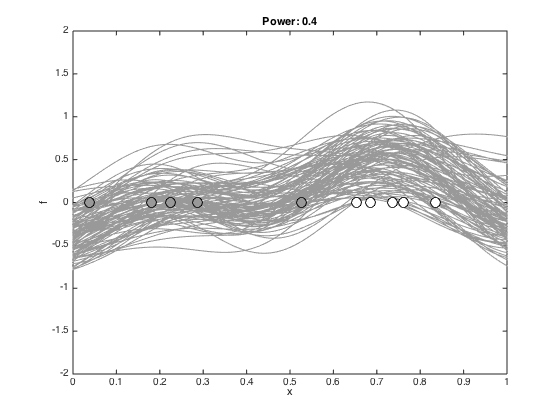
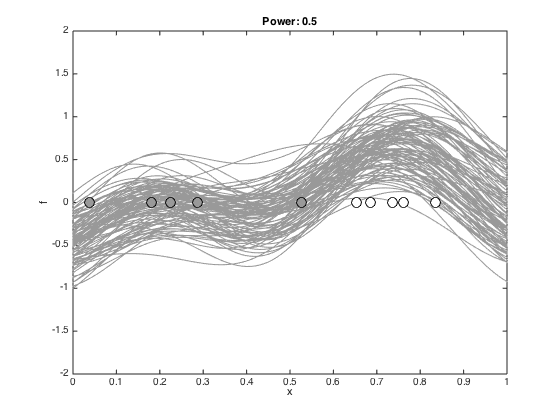
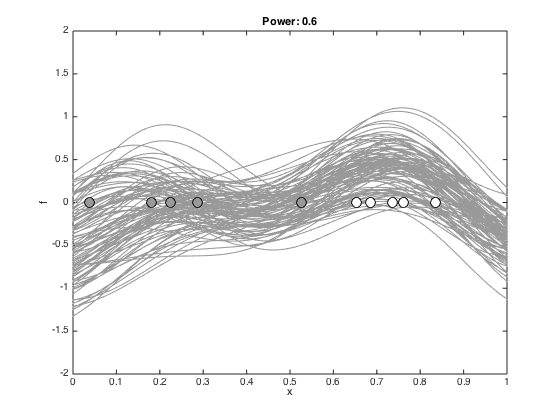
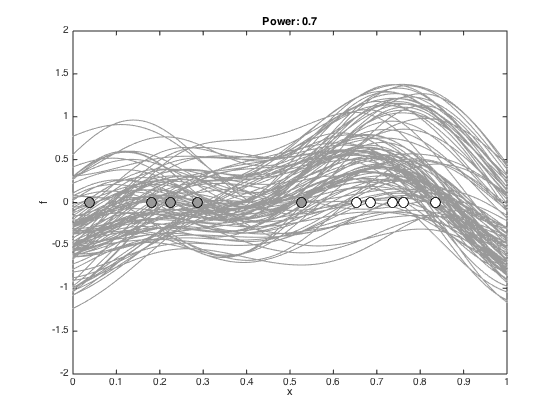
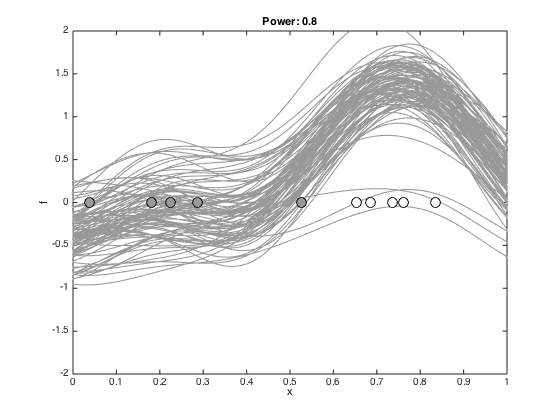
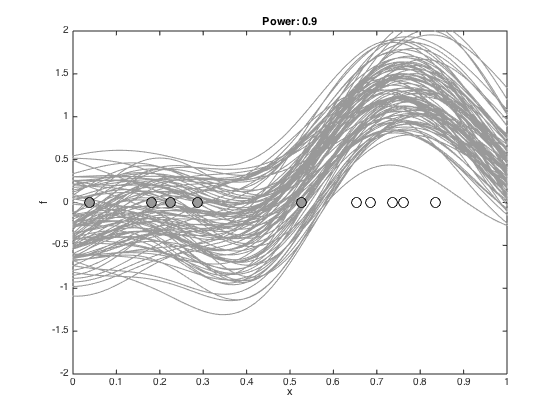
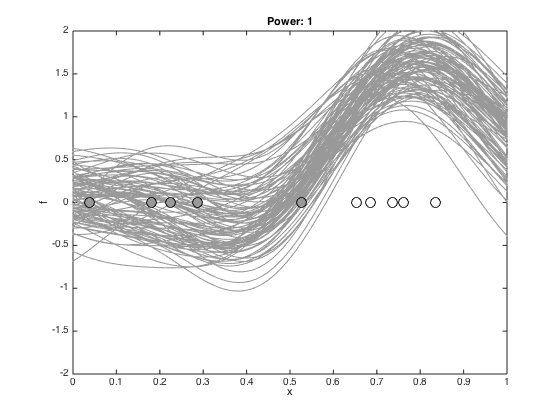
Set the temperature schedule
pow_vals = [0.1:0.1:1];
for pow_ind = 1:length(pow_vals)
    pow = pow_vals(pow_ind);
    % Compute likelihoods
    probs = normcdf(f_samp);
    log_prob = sum(log(1-probs(:,1:5)),2) + sum(log(probs(:,6:10)),2);
    pp = pow*log_prob - 0.5*diag(f_samp*Ci*f_samp');
    % Create a new set of samples by sampling from the old set and adding
    % some jitter
    sam = exp(pp - max(pp));
    new_f_samps = [];
    for s = 1:n_samps
        pos = find(rand<=cumsum(sam),1);
        new_f_samps(s,:) = mvnrnd(f_samp(pos,:),0.05*C,1);
    end
    f_samp = new_f_samps;
    % Plot the test values according to these new samples for visualisation
    figure(); hold off
    for s = 1:n_samps
        f_samp_test(s,:) = (testC'*Ci*f_samp(s,:)')';
    end
    plot(testx,f_samp_test','k','color',[0.6 0.6 0.6])
    hold on
    pos = find(t==0);
    plot(x(pos),zeros(size(x(pos))),'ko','markerfacecolor',[0.6 0.6 0.6],'markersize',10);
    hold on
    pos = find(t==1);
    plot(x(pos),zeros(size(x(pos))),'ko','markerfacecolor',[1 1 1],'markersize',10);
    ylim([-2,2]);
    xlabel('x');
    ylabel('f');
    title(sprintf('Power: %g',pow));
end