A Bayesian Regression Approach to the Inference of Regulatory Networks from Gene Expression Data - Supplementary Information
Abstract
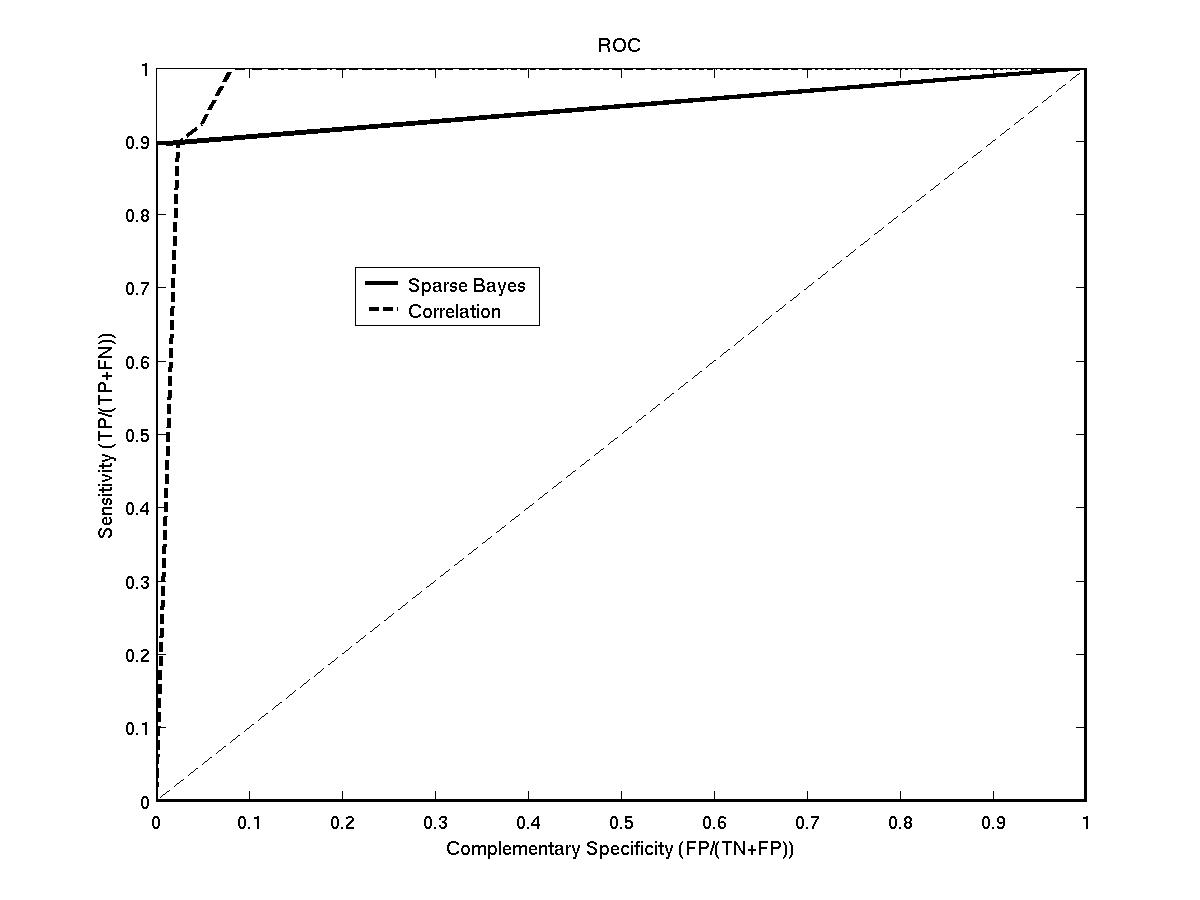
Results:Using simulated microarray expression data, we are able to show that this algorithm outperforms a recently published correlation based approach. Crucially, it does this without the need to set any threshold on possible connections.
Availability:Matlab code is available from http://www.dcs.gla.ac.uk/~srogers/old/nets/reg_nets.html
Contact:{srogers,girolami}@dcs.gla.ac.uk
Download
Matlab Code
Disclaimer: The code given below has been created and used on Matlab R13. It should work fine on other releases but no testing has been performed. Obviously, the code is distributed without any warranty and should the authors should be referenced in any publications quoting results from this code. No additional libraries are required to run this code. The main functions have been commented but some smaller functions have not. For more information e-mail srogers@dcs.gla.ac.uk.
- simple_script.m - runs a simple experiment
- create_data.m - creates a dataset
- make_network.m - creates a connectivity matrix
- euler_forward.m - integrates the set of SDE's
- ode_function.m - required by euler_forward.m
- cause_rvm_approach.m - organises the data and initialises the Sparse Bayesian algorithm
- rvm_regression.m - Sparse Bayesian regression
- calc_roc.m - calculates ROC statistics for plotting
- comp_roc_plot.m - plots ROC curves
Instructions: Download the archive above and extract it into a new directory. Load matlab, navigate to this new directory and type:
> simple_script
The script should then begin. The following output should be produced (see links for examples)
- An image of the complete data - data.jpg
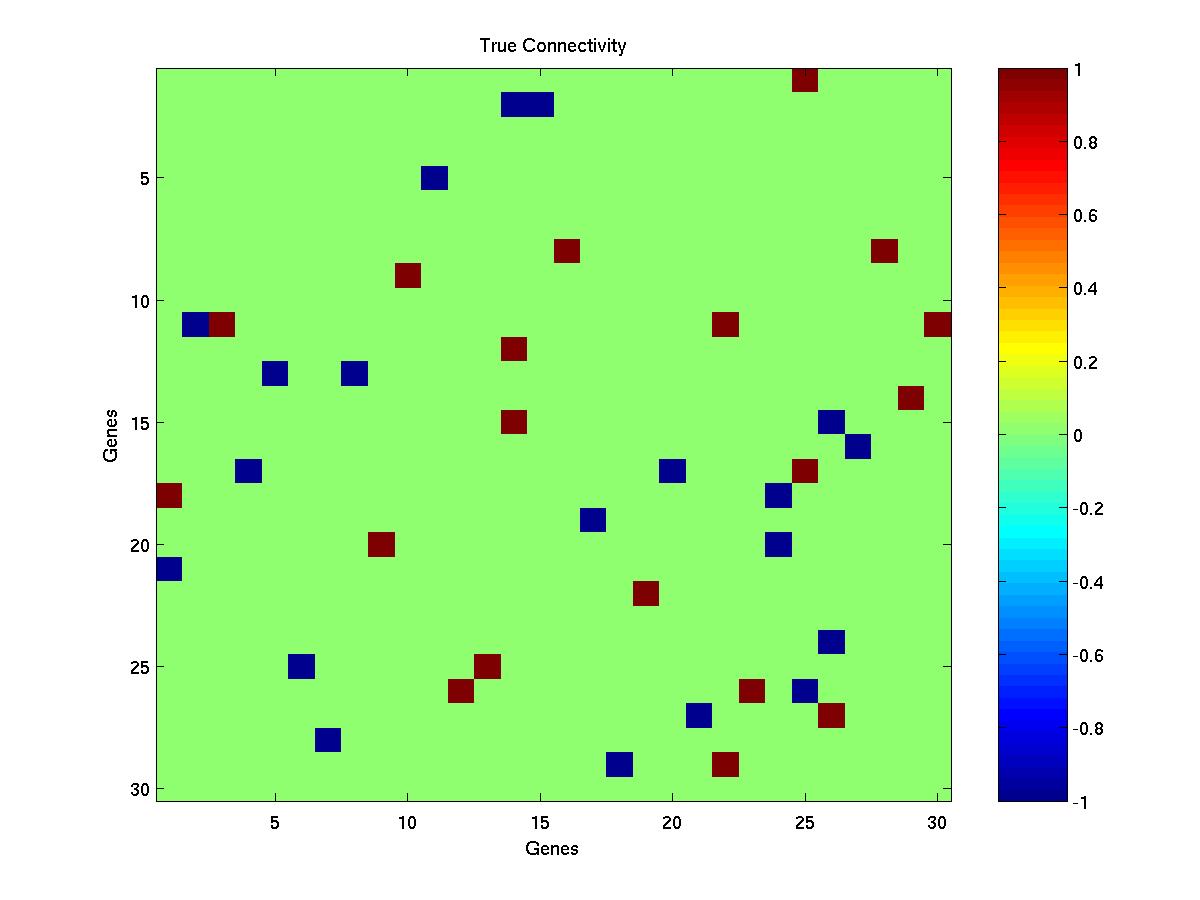
- The true connectivity matrix - conn.jpg. Each column corresponds to the connections out of a gene. Maroon squares show excitatory connections, blue inhibitory.
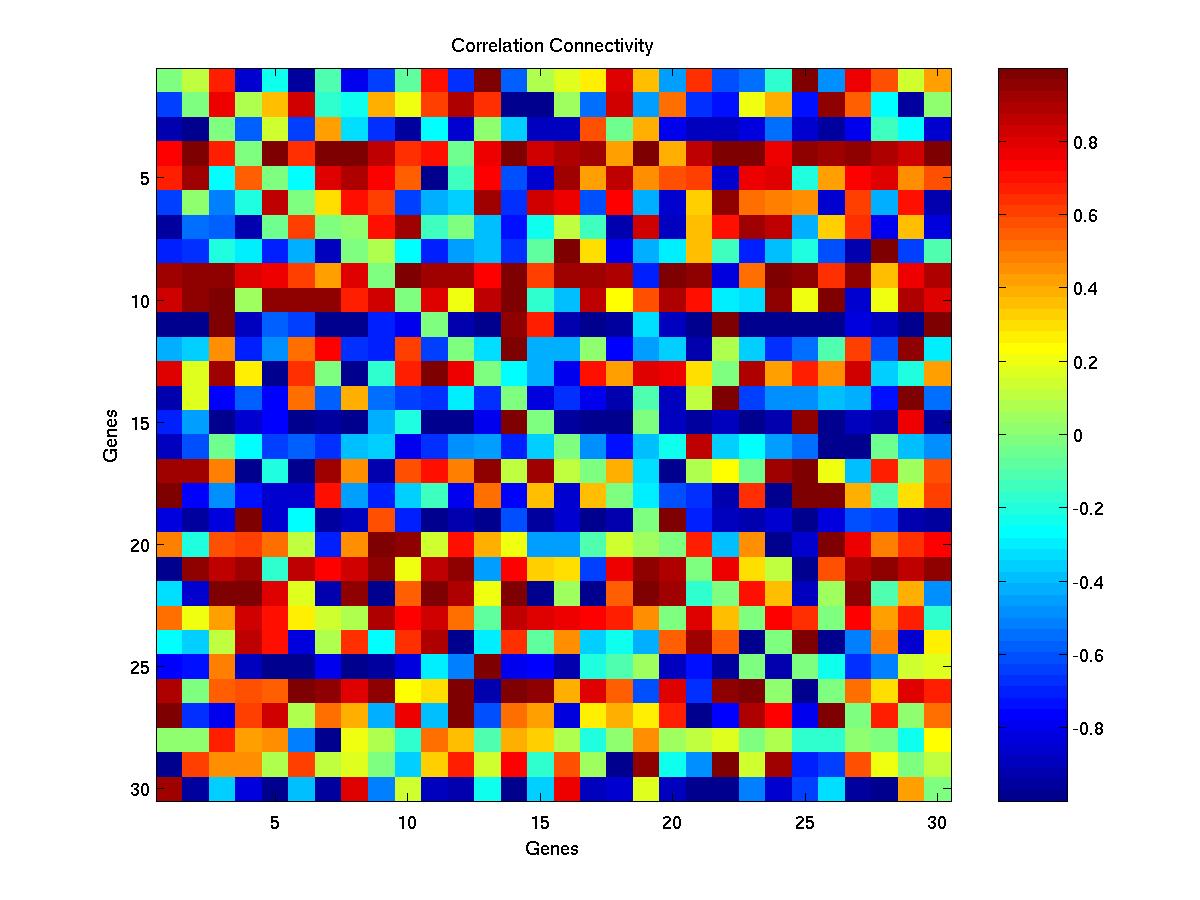
- The Correlation connectivity matrix - corr.jpg.
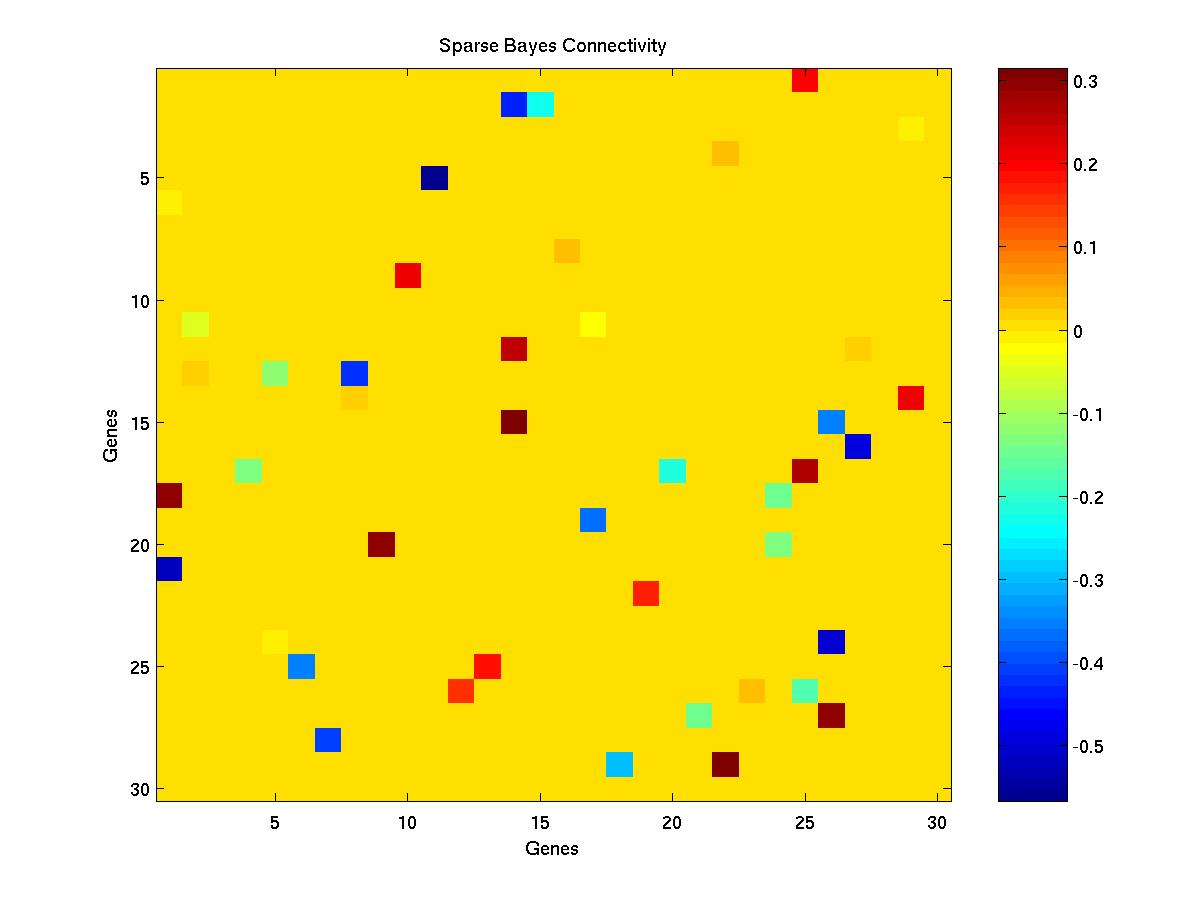
- The Sparse Bayes connectivity matrix - sb.jpg.
- ROC plot for the two methods - roc.jpg.

It should be fairly easy to modify any of the parameters set in the script. Any problems or comments, e-mail srogers@dcs.gla.ac.uk.