A Case Study in the Integration of Accident Reports and Constructive Design Documents
Chris Johnson
Department of Computing Science, University of Glasgow, Glasgow, G12 8QQ, UK. Tel: +44 (0141) 330 6053 Fax: +44 (0141) 330 4913 http://www.dcs.gla.ac.uk/~johnson, EMail: johnson@dcs.gla.ac.ukAbstract. Accident reports are intended to explain the causes of system failures. They are based upon the evidence of many different teams of experts and are, typically, the result of a lengthy investigation process. They are important documents from a software engineering perspective because they guide the intervention of regulatory authorities that must reduce the impact and frequency of system failures. There are, however, a number of problems with current practice. For example, the Rand report recently highlighted the lack of techniques that can investigate the role of software failure in major incidents. Similarly, there are no established techniques which help to insure that these failures are used to inform subsequent design. This paper, therefore, shows how a number of relatively simple graphical notations can be used to improve the next generation of accident reports.
1. Introduction
Given the importance of accident reports for the development and operation of safety-critical systems, it is surprising that there has been relatively little research into the utility of these documents [1]. The mass of relevant literature about safety-critical development [2, 3] and even the usability of design documents in general [4] is not matched in the field of accident reporting. The bulk of research continues to focus upon techniques that can be used to analyze the causes of software failure rather than upon the delivery mechanisms that publicize those findings to practicing interface designers and systems engineers. This paper, therefore, presents techniques that use findings about previous failures to inform the subsequent development of safety-critical computer systems. This is justified by the recent Rand report into the "personnel and parties" in NTSB aviation accident investigations. This argues that existing techniques fail to meet the challenges created by modern software components:
"As complexity grows, hidden design or equipment defects are problems of increasing concern. More and more, aircraft functions rely on software, and electronic systems are replacing many mechanical components. Accidents involving complex events multiply the number of potential failure scenarios and present investigators with new failure modes. The NTSB must be prepared to meet the challenges that the rapid growth in systems complexity poses by developing new investigative practices." [5]
The Rand report argues that we know relatively little about how to investigate and report upon the growing catalogue of software induced failures. By software "induced" accidents we include incidents that stem from software that fails to perform an intended function. We also include failures in which those intended functions were themselves incorrectly elicited and specified.
1.1 The London Ambulance Case Study
The failure of the London Ambulance Computer Aided Dispatch system is used to illustrate the argument in this paper. The financial consequences of this incident were not particularly significant. It is estimated to have cost between £1.1 and £1.5 million. In contrast, problems with the UK Taurus stock exchange program cost £75-£300 million. The US CONFIRM system incurred losses in the region of $125 million [6]. Nor was it notable in terms of loss of life. Coroner’s courts did not record any fatalities due to this failure. However, the problems of the dispatch system were the focus of attention from the national and international media. More importantly, it typifies the majority of computer related accidents that McKenzie argues are caused more "by interactions of technical and cognitive/organizational factors than by technical factors alone" [7].
The London Ambulance Service Computer Assisted Dispatch (LASCAD) system was commissioned to improve call handling and to improve the dispatch of ambulances. Secondary functions were also included to improve the auditing facilities that enabled management to understand the nature and pattern of these calls. There was also a requirement to understand how the availability of specific resources changed over time. The system was also intended to monitor response times within the UK capitol [8]. The architecture of the system included an automatic vehicle locating system and mobile data terminals that were to enable dispatch staff to communicate with their crews [9]. The system was also intended to replace the existing manual procedures.
LASCAD went live on the 26th October 1992. In the month before that date, the system was operated in a semi-manual fashion. Calls were taken via the system and paper copies were printed as back-ups to the electronic information. An allocator was assigned to work with a radio operator and a dispatcher. Central Ambulance Control staff could, therefore, override suggested resource allocations when a number of problems occurred. The following list summarizes these problems. It should be noted that the term "exception" is used to describe a wide range of error messages displayed by the system rather than the more usual sense of the word within software engineering:
"1. Failure to detect all duplicated calls;
2. Lack of prioritization of exception messages;
3. Exception messages and awaiting attention calls scrolling off the top of the allocators’/exception
rectifiers’ screens;
4. Software resource allocation errors;
5. Workstation and mobile data terminals lockups;
6. Slow response times for certain screen-based activities" ([8] page 40).
A number of changes were made to the system in the light of these problems. However, these focussed on the management and operation of the software rather than on the bugs themselves. The decision was made to run the system without the manual backup and to extend the scope of the trial from three divisions to cover the entire capitol:
"On 26 and 27 October 1992, the computer system itself did not fail in a technical sense. Response times did on occasion become unacceptable but overall the system did what it had been designed to do. However, much of the design had fatal flaws that would, and did, cumulatively lead to all of the symptoms of system failure. In order to work effectively, the system needed near perfect information all of the time. Without this the system could not be expected to propose the optimum resource to be allocated to an incident. There were many imperfections in this information, which individually may not have been serious, but which cumulatively were to lead to system "failure". The changes to Central Ambulance Control operation on 26 and 27 October made it extremely difficult for staff to intervene and correct the system. Consequently, the system rapidly knew the correct location and status of fewer and fewer vehicles. The knock-on effects were: 1. poor, duplicated and delayed allocations; 2. a build up of exception messages and the awaiting attention list; 3. a slow up of the system as the messages and lists built up; 4. an increased number of call backs and hence delays in telephone answering". ([8], page 41).
As a result of these problems, the Central Ambulance Control resorted to semi-manual operation. This was based on the methods that were adopted in the month prior to the 26th and 27th October. The system achieved a certain amount of acceptance. Local stations could override some of the automated allocations. However, shortly after 2am on 4th November the system slowed and then locked-up. Re-booting failed to rectify the problem. This had serious consequences. It was impossible to print out information about the calls that were already in the system. As a result, management had to go back and monitor the voice recordings of incoming calls that had been received in the period immediately before the failure. Once this was done, they then reverted to fully manual operation.
"The Inquiry Team has concluded that the system crash was caused by a minor programming error. In carrying out some work on the system some three weeks previously the Systems Options programmer had inadvertently left in the system a piece of program code that caused a small amount of memory within the file server to be used up and not released every time a vehicle mobilisation was generated by the system. Over a three week period these activities had gradually used up all available memory thus causing the system to crash. This programming error should not have occurred and was caused by carelessness and lack of quality assurance of program code changes. Given the nature of the fault it is unlikely that it would have been detected through conventional programmer or user testing." ([8], page 45).
The consequences of these various failures were widely reported in the national and international press. One ambulance arrived to find that a patient had already died and had been taken away by the undertakers. Another ambulance eventually arrived eleven hours after assistance had originally been requested for the victim of a stroke. The Chief Executive of the London Ambulance Service resigned [9]. However, the official report also argued that Coroner’s courts had not cited the late arrival of an ambulance as the direct cause of a fatality during any of these failures.
2. Analyzing Human Error and Systems Failure
The terms of reference for the South West Thames Regional Health Authority Inquiry Team were:
"To examine the operation of the CAD system, including: a) the circumstances surrounding its failures on Monday and Tuesday 26 and 27 October and Wednesday 4 November 1992. b) the process of its procurement and to identify the lessons to be learned for the operation and management of the London Ambulance Service against the imperatives of delivering service at the required standard, demonstrating good working relationships and restoring public confidence" ([8], page 9).
The primary means of restoring public confidence and communicating these lessons from the failure was through the publication of their official report [9]. This section explains why it can be difficult for readers to identify the causes of incidents and accidents from conventional accident reports.
2.1 Locating the Evidence to Support an Argument
A range of technical, managerial, human factors and environmental causes were identified for this failure. Some of these were latent, they had existed for many years before the failure of the computer aided dispatch system. Others were catalytic; they arose directly from the detailed problems of developing and installing this particular application:
"The CAD software was not complete, not properly tuned, and not fully tested. The resilience of the hardware under a full load had not been tested… Staff, both within Central Ambulance Control and ambulance crews, had no confidence in the system and were not all fully trained… By the same token staff and their representatives need to overcome their concerns about previous management approaches, recognise the need for change, and be receptive to discuss new ideas. If ever there was a time and opportunity to cast off the constraints and grievances of the past years and to start a fresh management and staff partnership, that time is now". ([8], page 3)
It can be difficult for readers to identify the ways in which these latent and catalytic causes of an accident combined to contribute to an accident. The evidence that supports these conclusions is, typically, distributed over many different pages. The following line of analysis illustrates this point:
"… in awarding the contract for CAD to a small software house, with no previous experience of similar systems, London Ambulance Service management were taking a high risk". ([8], page 4)
The evidence that supports this argument appears in many different places throughout the Health Authority Report. As a result, readers must remember how the initial argument from page 4 is established by factual information that is provided on pages 18, 21, 34…
"Amongst the papers relating to the selection process there is no evidence of key questions being asked about why the Apricot bid, particularly the software cost, was substantially lower than other bidders. Neither is there evidence of serious investigation, other than the usual references, of Systems Options (Systems Options) or any other of the potential suppliers' software development experience and abilities. ([8], page 18)
"Systems Options are a well established, small software house with a good reputation amongst their many satisfied customers for technical quality. However, in taking on the London Ambulance Service project, which was far larger than anything they had previously handled, we believe that they rapidly found themselves in a situation where they became out of their depth" ([8], page 21).
"Systems Options admit that many of the programs could benefit from some tuning. To date they have been designed for functionality rather than speed and this area could usefully be revisited. Systems Options are keen to do this. All screen dialogues are written in Visual Basic, a comparatively new development tool designed primarily for fast systems development rather than the development of fast systems! It is possible that these programs could benefit from being rewritten in, say, C++ or even in the latest version of Visual Basic. Some minor efficiencies could be gained also by upgrading the operating environment to Windows 3.1 from the current 3.0. Developing the screen dialogues in Visual Basic was not envisaged at the time the Apricot/Systems Option proposal was produced. This development tool was released subsequent to this. Thus Systems Options were using an, at the time, unproven development tool designed primarily for prototyping and the development of small, non mission critical, systems". ([8], page 34)
This distribution of analysis and evidence creates significant problems for managers and software engineers who must exploit the recommendations of accident reports to guide the subsequent development of safety-critical systems. It is a non-trivial task to filter out the mass of contextual evidence presented between pages 18, 21 and 34 of the Health Authority document. Unless they can do this, however, it is difficult to trace the connection between poor procurement practices and the subsequent problems with the software developers, Systems Options. They would, therefore, miss the central point that the catalytic causes of the LASCAD failure stemmed from the latent problems of project management within the Ambulance Service [8].
2.2 Implicit Arguments
Readers must often re-construct the implicit arguments that are embedded within accident reports. For instance, the previous citation from page 4 argued that London Ambulance Service management was taking a high risk by employing a small software house such as Systems Options. This is supported by evidence on page 33 of the report. There were problems with the ways that Systems Options allowed informal pressures to circumvent recommended practices in the development of critical software:
"All quality problems with software or any other element of the system should have been communicated to the suppliers through the Project Issue Report (PIR) form procedures. This system was designed to enable control to be established over problems awaiting solutions. Each PIR was sequentially numbered to enable the control to be monitored. As already pointed out, these procedures were often circumvented by Systems Options who would on occasions amend software to meet individual user's wishes without going through the PIR route." ([8], page 33).
This argument was never explicitly made in the Health Authority report. The reader is forced to infer a link between the evidence on page 33 and the argument on page 4. In this instance, the inference seems well justified. However, previous work has shown that many readers construct a mass of causal explanations and inferences that were never intended by the producers of an accident report [1]. The lack of such explicit links may result in a mass of individual interpretations that can be contradicted by evidence elsewhere in the report but which can easily be missed or ignored by individual readers.
2.3 Alternative Lines of Reasoning
It can often be difficult to identify alternative hypotheses about the causes of an accident. For instance, the first of the following quotations presents the Health Authorities argument that the software house was a potential risk factor. The second quote is taken from a subsequent section of the report, which acknowledges that customers did provide favorable references for Systems Options:
"… in awarding the contract for CAD to a small software house, with no previous experience of similar systems, London Ambulance Service management were taking a high risk". ([8], page 4)
"The original proposal from Apricot, because of its form, did imply that Apricot would take this role. Indeed it is clear from project team minutes at the time that this was the expectation. Apricot subsequently made clear that it is corporate policy to take on such a role only if it is in a position to control the project itself. In a project such as CAD this would not be possible as the success of the system depended heavily on the quality of the software to be provided by Systems Options. However, throughout the procurement process and up to the project meeting of 21 May 1991, both London Ambulance Service and Systems Options believed that Apricot would prime the contract… At the time of the procurement recommendation references were being sought on Systems Options from certain of their existing customers. These references were very favourable as far as the technical quality of their work was concerned. However, the reference from the Staffordshire Fire and Rescue Service expressed some concerns over the continuing ability of the company to deliver results on time. There are two reference letters from Staffordshire and both refer to the extent to which Systems Options's resources were now stretched. These references should have raised warning bells with London Ambulance Service management, but apparently failed to do so. Indeed both executive and non-executive members of the London Ambulance Service Board have confirmed that they were not informed of adverse references having been received even though one of them was received by the London Ambulance Service systems team on 24 May 1991, four days before the Board meeting at which the recommendation was endorsed". ([8], page 20)
The layout of many conventional reports makes it difficult for readers to view the different perspectives that are offered by such arguments. In our example, the Health Authorities argument that Systems Options was a high risk is made on page 4. However, the admission that the London Ambulance Service management had received favorable, even if mixed, references occurs on page 20. Similarly, London Ambulance Service’s initial perception that Apricot and not Systems Options were leading the bid is not mentioned until sixteen pages after the initial argument. Such a separation makes it difficult for managers and software engineers to accurately assess the best means of avoiding future failures either through improved procurement practices or through better development practices.
3 Using Conclusion, Analysis and Evidence Diagrams to Visualize the Argument in Accident Reports
The previous section has argued that it can be difficult for designers, managers and software engineers to identify the many different items of evidence that support the arguments that are presented in accident reports. This is a particular problem when evidence is distributed through hundreds of pages of prose. It can also be difficult for readers to reconstruct the implicit links that analysts often develop between particular arguments and the findings of an accident report. Finally, it can be difficult for individuals to resolve the apparent contradictions that arise when accident reports present alternative lines of analysis. Additional contextual information must be provided if readers are to understand the limitations of these alternative arguments. This section goes on to present a number of graphical techniques that avoid these limitations.
3.1 A Brief Introduction to CAE Diagrams
Conclusion, analysis and evidence (CAE) diagrams were specifically developed to provide a graphical overview of the argument that is presented in accident reports. They stem from the observation that many root-cause analysis techniques advocate the separation of evidence and conclusions [11]. This has become embodied in the format of most accident reports. The events that occurred during an accident are, typically, described in different chapters from the conclusions of the report. This is useful because readers can form their own interpretation of events before reading the investigators’ analysis. However, such an approach can create problems when people are forced to recall important evidence that is presented many pages before or after the main findings. Problems can also arise if readers are never explicitly told which items of evidence support a particular conclusion.
Conclusion, Analysis and Evidence diagrams are graphs. The roots represent individual conclusions from an accident report. Lines of analysis that are connected to items of evidence support these. Each item of evidence either weakens or strengthens a line of analysis. Lines of analysis may also strengthen or weaken the conclusion at the root of the tree. More formally, Conclusion, Analysis and Evidence diagrams are directed graphs CAE = (C, A, E, Sc, Wc, Sa, Wa). They consist of a set of conclusions, C, arguments, A, evidence, E. Four further sets are used to represent the four different types of edges that are recognized. Sc represents edges that connect particular conclusions to the lines of analysis that support them. Wc represents the edges that connect particular conclusions to the lines of analysis that weaken them. Wa represents the edges that connect particular the lines of analysis to the evidence that weakens them. Sa represents the edges that connect particular the lines of analysis to the evidence that supports them. Edges connect conclusions and analysis: Sc U Wc subseteq {C x A}. Edges also connect analysis and evidence: Sa U Wa subseteq {A x E}. The subseteq operator indicates that CAE graphs need not be fully connected. Some items of evidence will have little impact on some lines of argument. From these basic definitions, it is possible to construct a number of more detailed consistency requirements. For example, it might be stipulated that the same item of evidence couldn’t both support and weaken a line of analysis. Similarly, the same line of argument or analysis should not both weaken and strengthen a conclusion:
" c Î E, " a Î A: Ø ( (c, a)Î Sc Ù (c, a) Î Wc) 1.
" e Î E, " a Î A: Ø ( (a, e)Î Sa Ù (a, e) Î Wa) 2.
Such consistency requirements are not explicitly part of the CAE notation. The intention is to provide a relatively simple formalism that can be applied to model the many different forms of argument that are presented in an accident report. Of course, it might be desirable that every accident report obeyed 1 and 2 in the presentation of their findings. Sadly this is not always the case and so it will not be possible to respect these formulae when depicting the argumentation in many accident reports. The following procedure is used during the generation of CAE diagrams:
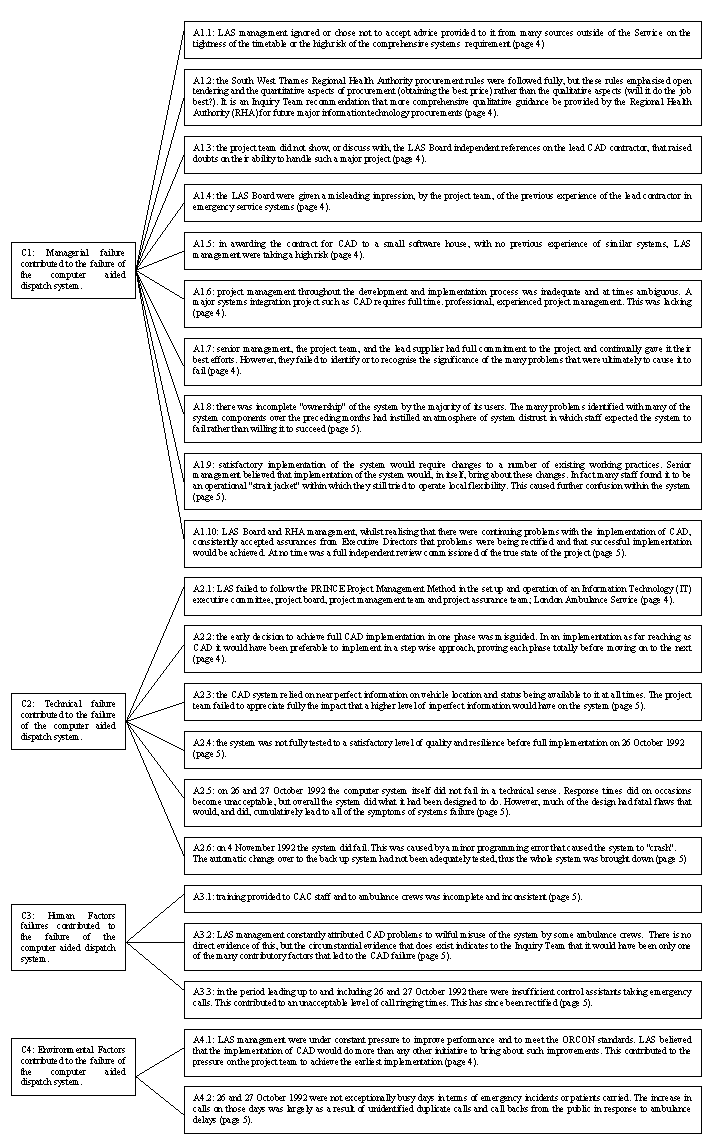
The CAE diagram in Figure 1 presents the results that were obtained from applying stages 1 and 2 described above, to the regional health authority report. A number of simplifying assumptions had to be made. In particular, we only show twenty-one of the forty-six causes that were identified. This decision is justified by our focus on the future development of the Computer Aided Dispatch system itself. The remaining arguments focussed on the wider managerial and operational activities of the London Ambulance Service. It is a relatively trivial task to extend the diagram to include all lines of analysis in the report.
Further caveats relate to the distinction between conclusions and analysis that is embodied within CAE diagrams. The many different lines of analysis that are shown in Figure 1 are termed ‘conclusions’ within the Health Authority report. These distinctions have a considerable impact upon the structure of the resulting CAE diagrams. The approach exploited in this paper leads to a smaller number of graphs, each with a higher branching factor. This has the advantage that analysts can quickly see when different lines of argument rest on similar items of evidence. If we had retained the terminology of the original report then a much larger number of smaller graphs would have been developed. We have exploited this approach in a previous paper [12]. However, it should be noted that this approach introduces considerable additional complexity as the number of distinct CAE diagrams increases to represent each of the forty-six conclusions in the Health Authority report.

Fig. 1. Initial Conclusion, Analysis, Evidence (CAE) Diagram for the London Ambulance Failure
3.1 Locating the Evidence to Support an Argument
Figure 1 represents stages 1 and 2 in the construction of a CAE diagram. It does not present the evidence that supports or weakens the lines of argument that are made by the official report. Previous sections have argued that readers must manually search for this evidence throughout the dozens or even hundreds of pages in many conventional accident and incident reports. In contract, Figure 2 shows how evidence can be explicitly represented within the graphical notation of a CAE diagram.
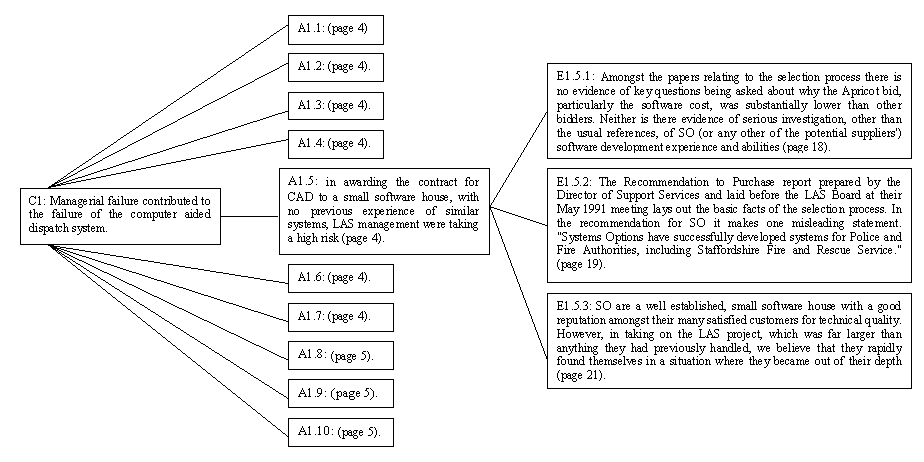
Fig2. Using CAE Diagrams to Represent Arguments About Managerial Failure in Software Procurement
The report concluded that managerial problems had contributed to the failure. This is shown in Figure 2 by the node labeled C1. These problems included the decision to award the contract for the dispatch system to a small software house. The node labeled A.1.5 illustrates this argument that high risks were associated with the contracting of Systems Options. This line of reasoning is supported by several items of evidence in the body of the report. For example, the Apricot/Systems Options bid was substantially lower than the other tenders. This evidence is cited on page 18 and is denoted by node 1.5.2. Similarly, misleading statements in the Recommendation to Purchase also support arguments about the risks associated with Systems Options. This evidence is provided on Page 19 and is shown in 1.5.3. Finally, the Computer Aided Dispatch system was significantly bigger than anything Systems Options had tackled before. This evidence is cited on page 21 and is shown in 1.5.4.
Figure 3 extends the previous CAE diagram to present evidence that does not support the conclusions in the official report. The Regional Health Authority Standing Financial Instructions stated that the lowest tender should be accepted unless there were sufficient reasons to the contrary. This is denoted by E1.5.1. This weakens the argument that managerial failure led to the appointment of Systems Options. They were simply following approved guidance, which can be seen as entirely reasonable for a Regional Health Authority. Such alternative lines of analysis are denoted by dotted lines. A second argument, A1.5.5, also contradicts the claim that the appointment of Systems Options was a high-risk strategy. Existing customers were happy with the company’s work. This line of argument leads to further complexity because the evidence of previously satisfied customers, E.1.5.5.1, must be balanced against letters from Staffordshire Fire and Rescue Service that specifically mention recent problems with the company.
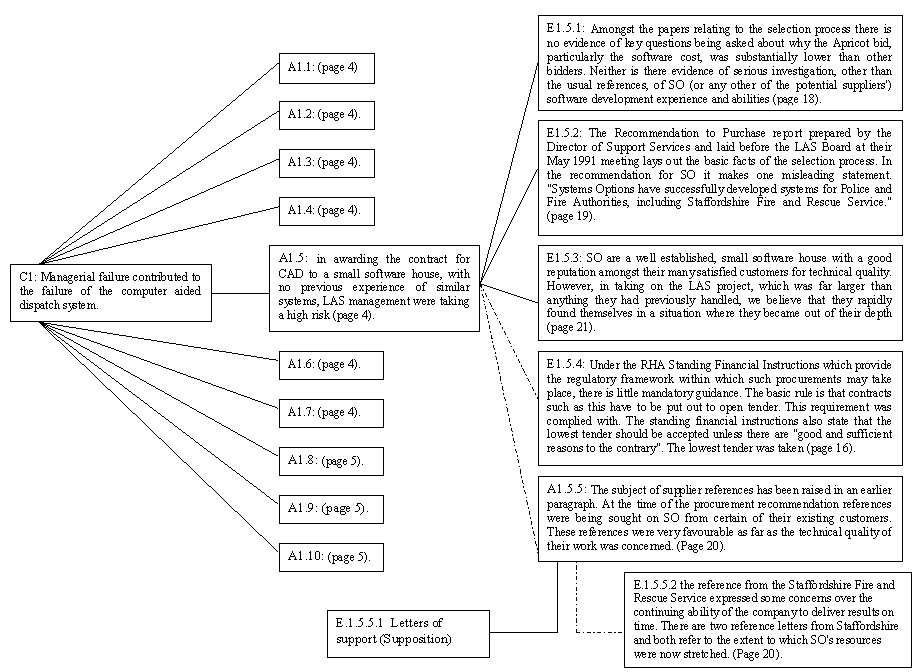
Fig3. Using CAE Diagrams to Represent Arguments About Managerial Failure in Software Procurement
Figure 3 explicitly represents the ways in which evidence can both support and weaken an investigator's analysis of an accident or incident. The intention is not that CAE diagrams should replace conventional reporting techniques but that they should provide an overview and structure for the argument that these documents contains. They provide a road map for the analysis that is presented in an accident report.
3.2 Implicit Arguments
CAE diagrams can also help readers to identify the implicit inferential chains that are a common feature of many accident reports [12]. For example, Figure 4 shows how evidence on page 25 of the Health Authority report supports the claim on page 4 that the lack of an accepted project management technique led to technical problems during the development and testing of the software. In particular, E:2.1.7 reports that the project manager failed to address problems that were recognized with the communications infrastructure. This evidence is not explicitly linked to the previous argument about project management failure in the body of the report. The CAE diagram makes explicit this link between evidence that was gathered during the investigation and the higher level arguments that are made earlier in the account of the failure.
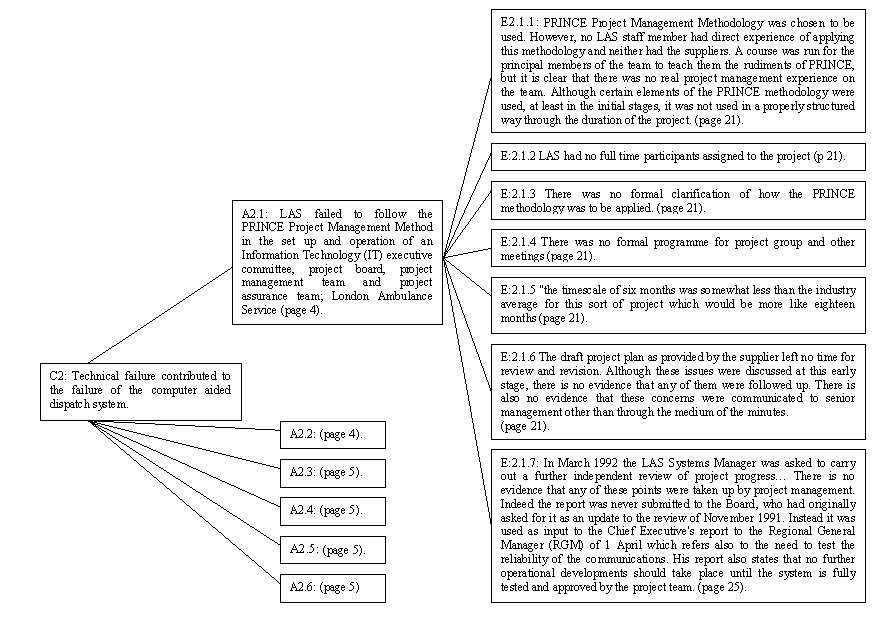
Fig. 4. Using CAE Diagrams to Represent Implicit Arguments.
Figure 4 also illustrates some of the subjective decisions that have to be made during the construction of CAE diagrams. The failure to follow the PRINCE methodology is classed as an argument in support of the conclusions about technical failure. This is based on the premise that any such methodology would ultimately control the allocation of resources to the activities within the hardware and software development cycle. However, this argument also supports conclusions about managerial weakness. This illustrates how the construction of CAE diagrams cannot be fully automated. Accident reports are subjective documents. They present an argument or viewpoint on the causes of an accident. CAE diagrams, such as that shown in Figure 4, help to provide a common focus for discussion about these arguments.
3.3 Alternative Lines of Reasoning
Figure 5 illustrates alternative arguments about the evidence that is shown in Figure 4. In particular, the fact that no London Ambulance Service participants were assigned to the project on a full-time basis leads to two further lines of analysis. Firstly, A:2.1.2.1 cites a section of the official report which argues that "There is absolutely no doubt that a professional independent project manager would have been of considerable assistance with this project. Any project such as this which is highly technical, time critical, and involves significant systems integration of different technologies from different suppliers is a full time job to manage". However, later sections weaken this argument. These suggest that a full-time project manager would not have directly solved many of the problems that arose with the project (A:2.1.2.2). This is important because it raises further questions about whether there is any evidence to support the assertion that a full-time project manager would really have had this impact given the myriad of other political, cultural and technical problems that are identified in the report. Again, the use of the CAE notation shows that these arguments, A:2.1.2.1 and A:2.1.2.2, must be supported by further evidence if they are to carry any weight beyond that of a speculative hypothesis.
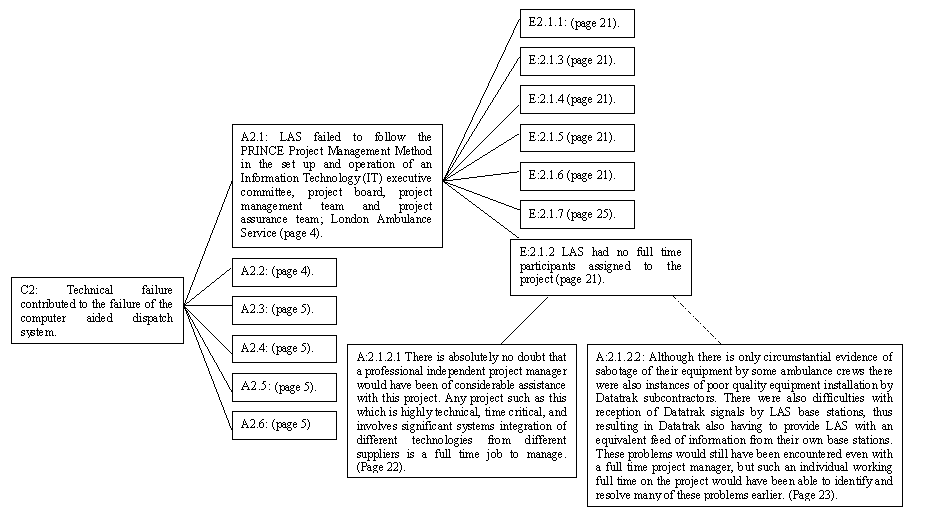
Fig. 5. Using CAE Diagrams to Represent Alternative Arguments
Figure 5 illustrates the complexity of arguments that are routinely used in accident and incident reports. CAE diagrams not only provide readers with an overview of the arguments that are being presented in these documents. They can also provide writers with an appreciation of the arguments that they expect their readers to reconstruct. As the diagrams become more complex then it can be argued that practicing developers and regulators will have increasing problems in understanding these arguments [14]. It is perhaps unsurprising, therefore, that empirical study and subjective questionnaires have revealed that many engineers and managers completely fail to follow much of the analysis that these documents contain [10].
3.4 Extending a Line of Argument
Previous CAE diagrams in this paper have focussed on the managerial causes of the failure. However, Figure 1 also provided a high level over view of the environmental, human factors and technical issues that contributed to this incident. Figure 6, therefore, explores some of these technical issues in more detail. In particular, it focuses on the argument that the system was not fully tested before full implementation (A:2.4). This argument is contradicted by evidence in the body of the report, E:2.4.1. This states that there are references to functional testing throughout the project. However, the original line of analysis is supported by the lack of any evidence about attempts to simulate the loading and work patterns associated with the final implementation.
Figure 6 again illustrates the complexity of the arguments that are presented in accident reports. In particular, A:2.4.4 presents a further caveat about the lack of testing. Parts of the system were tested with a realistic loading. This completes a complex line of reasoning that the readers of a conventional accident report must piece together from dozens of pages of prose. The system was not fully tested to a satisfactorily level of resilience before full implementation. It is recognized that this is difficult if not impossible but simulation techniques could have been used for partial testing. In turn, this argument is weakened by the fact that sub-sets of the system were successfully tested following the partial success of the call taking system.
There are strong differences between CAE diagrams and other notations that have been used to support accident analysis, such as Fault Trees [1]. These formalisms are, typically, used to map out the timeline of operator 'error', system 'failure' and managerial weaknesses that leads to an accident. In contrast, CAE diagrams represent the analytic framework that is constructed from the evidence about those events. In this respect, our approach shares much in common with Ladkin, Gerdsmeier and Loer's WB graphs [15].
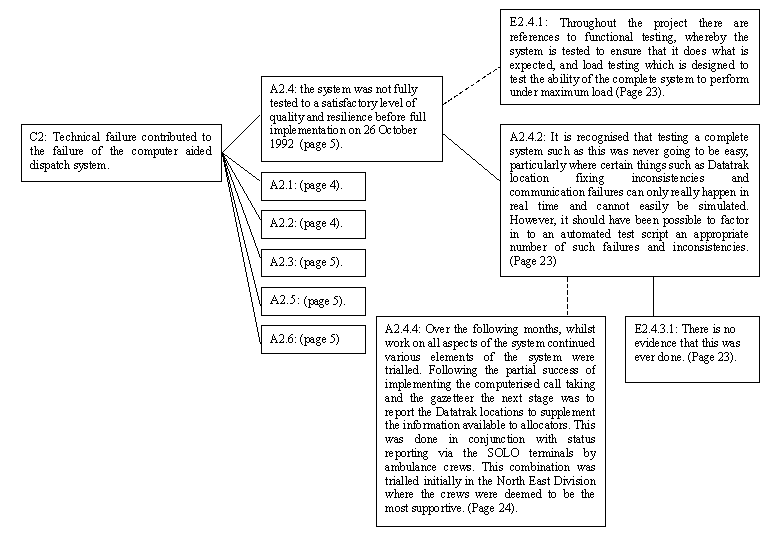
Fig. 6. Using CAE Diagrams to Represent Further Lines of Analysis
4. Literate Investigations
The previous section has shown how diagrammatic techniques can be used to support the presentation of accident reports. This has important consequences for software development. Firstly, CAE diagrams encourage accident investigators to explicitly document the evidence that supports claims about the latent managerial, regulatory and technical problems that lead to particular bugs. Secondly, they help the readers of an accident report to trace and understand the arguments that lead to those claims. Such benefits are of little value, however, if designers cannot exploit the products of accident investigations to support development. This section, therefore, explains how techniques from design rationale [16] and contextual task analysis [17] can be used in conjunction with CAE diagrams to provide a link between the analytical techniques of accident investigations and the constructive techniques of software and hardware development.
4.1 Design Rationale
Accident reports do not simply focus on what did, and what did not, cause an accident. They also play an important role in identifying the potential design options that might avoid future failures. The following citations present some of the recommendations that can be found at various places in the Health Authority’s report:
"Appropriate resilience measures will need to be built in to ensure that calls are not lost due to equipment or power failure and that the system has appropriate backup to cover any such contingency." ([8], Page 49).
"The fallback to the second server was never implemented by Systems Options as an integral part of this level of CAD implementation. It was always specified, and indeed implemented, as part of the complete paperless system and thus arguably would have activated had the system actually crashed on 26 and 27 October 1992. However, there is no record of this having been tested and there can be no doubt that the effects of server failure on the printer-based system had not been tested. This was a serious oversight on the part of both London Ambulance Service IT staff and Systems Options and reflects, at least in part, the dangers of London Ambulance Service not having their own network manager." ([8], page 45)
"The computer hardware is industry standard "IBM compatible" workstations and file servers. At a minimum the existing workstations could be used for any future system and, it is probable that the file servers could also be used –regardless of whether or not the current software is replaced or extended. However, additional memory and faster processor chips may have to be added to the workstations and the file servers in order to enhance performance. Other fine-tuning may also be required. ([8], Page 46).
"It will be necessary also, as part of this phase, for the printing of incident information for use by resource allocators. In order to achieve this safely it will be necessary to acquire more robust and faster printers, integrate them fully as part of the network, and institute safeguards, to ensure that all calls are printed and acted upon. The continued use of printers may seem a slightly primitive method of working, but it has the advantage of easy integration with existing resource allocation and mobilisation practices, and provides confidence to
Central Ambulance Control staff that a paperless environment initially would not have." ([8], Page 48)CAE diagrams provide a graphical representation of the arguments that accident reports construct for the causes of accidents and incidents. They do not, however, provide means of representing the design recommendations that are illustrated by the previous citations. In contrast, design rationale notations provide a graphical overview of the arguments that support development decisions [18]. For example, Rank Xerox’s Questions, Options and Criteria notation provides a means of explicitly representing the design options that might be used to answer particular development questions. For example, the question of how to resolve the LASCAD failure might have been addressed by completely rebuilding the system. Another option might have been to commission another company to salvage as much of the original implementation as possible. These various options can be assessed in terms of whether or not they satisfy particular criteria, such as long-term cost or estimated time to completion.
Figure 7 illustrates some of the design options that might improve the reliability of the dispatch system. The first option is integrate the dispatch system with a paper backup. This would involve printing records of all calls and dispatch decisions so that staff could revert to these in the event of a failure. The solid line between this design option and criteria Cr1.1 indicates that this is supported by the argument that it represents a low cost solution in the short term. The dotted lines indicate a criteria that does not support a design option and so the paper based backups do not provide low recurrent costs nor do they reduce the risks of primary system failure. The second option is to maintain a hot backup to the primary servers. This is supported by low retention costs because it avoids the administration and maintenance of paper based backups. Cr.1.4. also indicates how this option avoids the delays that can arise in switching to a paper-based system in the event of a failure. Finally, there is the option of completely re-designing the primary and secondary systems, O.1.3. This can reduce the risks of failure in the existing primary system, Cr.1.3, but is not a low cost option, Cr.1.1. It will, however, be possible to implement a full audit system to check the performance of the new system under potential failure scenarios.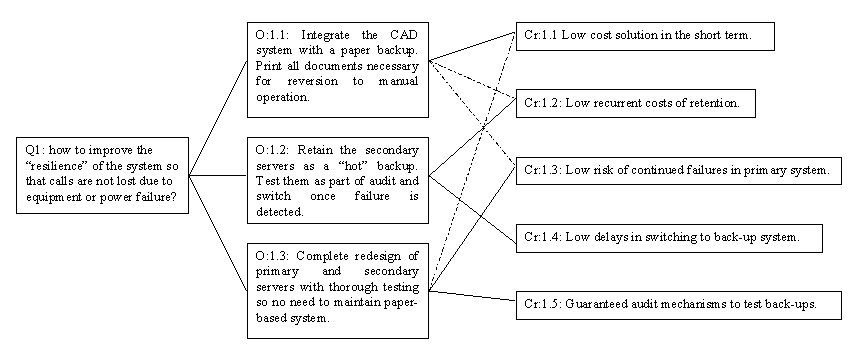
Fig. 7. Questions, Options and Criteria diagram showing design options for improved reliability.
As can be seen, the QOC syntax is slightly simpler than that associated with CAE diagrams. Negative and positive links can only be drawn between options and criteria rather than between conclusions and analysis and between analysis and evidence. QOC = {Q,O,Cr, So, Wo} and So U Wo Í {O x Cr}. Notice that Cr is used to denote the set of criteria rather than C which is used to denote the set of conclusions in CAE diagrams. As before, it is important to notice the use of the Í operator because neither QOC’s nor CAE’s require fully connected graphs to be drawn. It is perfectly possible for some criteria to have little or no relevance for particular options. Similarly, some items of evidence will have little or no baring on some lines of analysis.
A major limitation with the QOC diagram shown in Figure 7 is that it provides little or no indication of the status or source of the criteria that are represented. In other words, we have no means of assessing whether or not the time delay in switching to a paper back-up really is a significant issue. Such problems can be avoided by integrating design rationale techniques, such as the QOC notation shown in Figure 7, with previous findings about accidents and incidents, such as the problems with the dispatch system.
4.2 Using Accidents to Provide Contextual Support For Development Decisions
Figure 8 integrates CAE and QOC diagrams for the failure of the London Ambulance system. The CAE diagram represents the Health Authorities findings that technical failures contributed to the problems on the 26-27th October and the complete failure on the 4th November. A link is then drawn to the QOC diagram to show that this finding justifies designers in considering how to improve the reliability of the system through paper back-ups and "hot redundancy". It is important not to underestimate the benefits that such links provide. In particular, the technique can be extended beyond the specific circumstances of the London system to help identify critical development decisions in similar future projects. Problems very similar to those described in the Health Authority report recurred in several other dispatch-systems throughout the globe [9]. In other words, it is possible to use the integration of analytical techniques from accident investigation and constructive design rationale techniques to identify generic solutions to previous failures. In this case, any reliance on a hot back-up depends on the ability to test the transfer of control as part of an audited and recurrent maintenance programme.
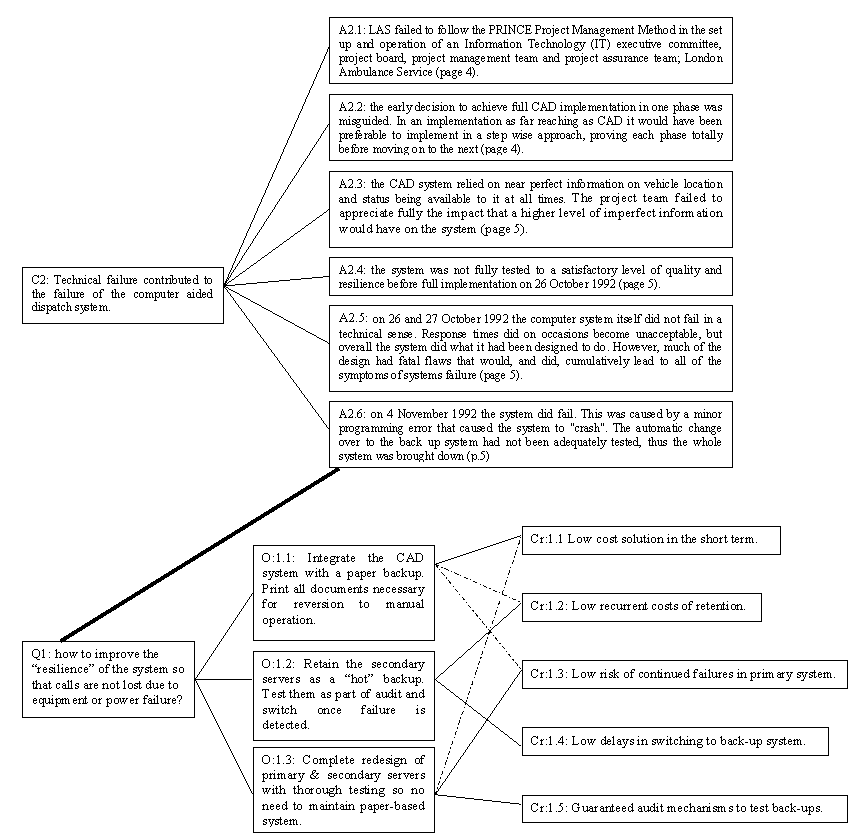
Fig. 8. Using Previous Operator 'Errors' to Justify Asking the Questions in QOC Diagrams.
There are further benefits from this closer integration of accident analysis techniques and constructive design documents. For instance, it is relatively easy to provide well considered solutions to the problems that are addressed in safety cases. It is less easy to know what problems should be anticipated during the development of safety-critical software [18, 19]. By linking development documents directly to the products of accident investigations, it is possible to ensure that designers base their subsequent development decisions at least partly upon those problems that have arisen with previous applications.
Further links can be drawn between the analytical products of accident investigations and the constructive use of design rationale. For instance, evidence about previous failures can be used to support particular lines of argument in a QOC diagram. Figure 9 illustrates this approach. The availability of audit mechanisms that can be used during the validation and testing of any back-ups is supported as a development criteria because there is no such evidence available for the primary or secondary systems during simulated tests of the London Ambulance system. This design criteria is also supported by the argument that even though it is difficult to test "complete" systems such as the computer aided dispatch software, simulated loading and failure scenarios might have helped to detect the potential flaws that led to the failure of this application.
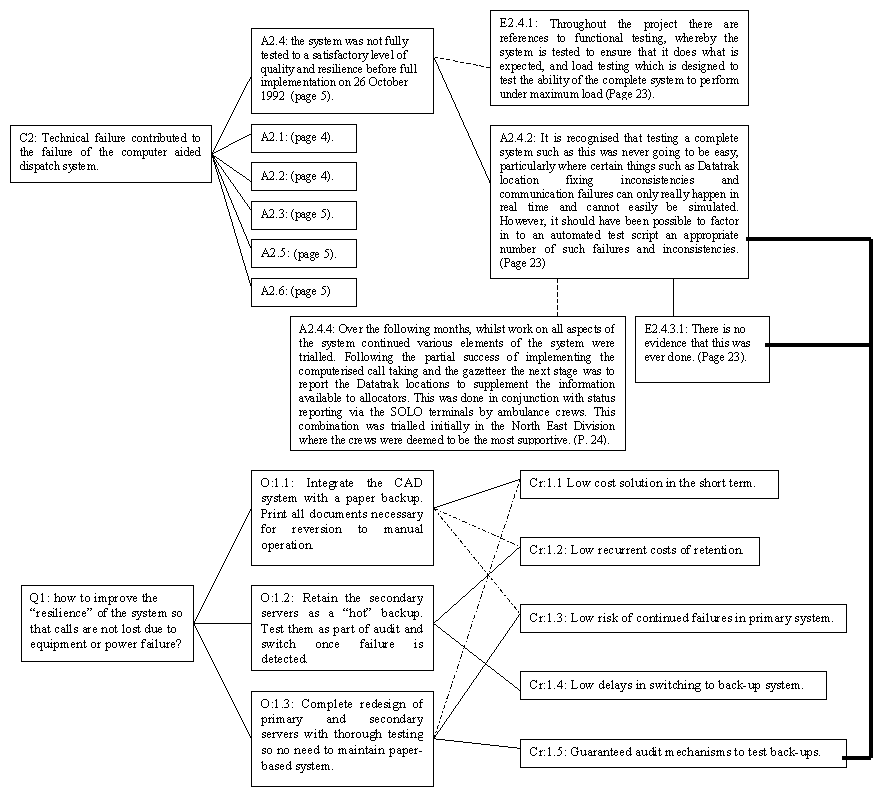
Fig. 9. Using Previous Failures to Justify Design Criteria in QOC Diagrams.
5. Conclusion and Further Work
Accident reports are a primary mechanism by which software engineers can learn from the mistakes of the past. These documents analyze and explain the causes of systems failure. Unfortunately, a range of recent work has identified limitations and weaknesses in conventional reporting techniques [1, 5, 10]. It can be difficult for readers to locate the evidence that supports particular arguments about the latent and catalytic causes of an accident. These items of information can be scattered throughout the many different pages of an accident report. A second problem is that readers are often forced to reconstruct complex chains of inference in order to understand the implicit arguments that are embedded within accident reports. Finally, it can be difficult to identify alternative hypotheses about the causes of software and hardware failures given existing reporting techniques.
This paper has argued that the graphical structures of Conclusion, Analysis, Evidence (CAE) diagrams can be used to avoid the problems mentioned above. These explicitly represent the relationship between evidence and lines of argument. They also provide a graphical overview of the competing lines of argument that might contradict particular interpretations of systems failure. However, these diagrams do not directly support the subsequent development of safety-critical systems. In particular, previous work has not provided means of exploiting these diagrams within safety cases. We have, therefore, argued that design rationale techniques be integrated with the argumentation structures of CAE diagrams. This offers a number of benefits. In particular, the findings of previous accident investigations can be used to identify critical design questions for the subsequent development of safety-critical applications. Similarly, the arguments that support or weaken particular design options can be linked to the arguments in accident reports. Previous instances of software failure can be cited to establish the importance of particular design criteria. This helps to ensure that evidence from previous accidents is considered when justifying future development decisions.
This paper has restricted our use of CAE diagrams. Evidence has been shown to explicitly support or weaken lines of analysis. We have not allowed probabilistic information or certainty factors to be incorporated into the resulting graphs. This decision is explained in pragmatic terms. Most accident reports do not present stochastic or Bayesian forms to support their arguments. However, it would be feasible to integrate this information if necessary. The resulting graphs would have strong similarities to some of the models that have been developed to support decision theory [20]. We have, however, resisted this approach because of the well-known problems of validating subjective certainty factors. These problems would be exacerbated by the biases that continue to affect individual judgement in the aftermath of an accident or major incident.
Much further work remains to be done. We have empirical evidence to support the use of design rationale by practicing software engineers with real-world design tasks [18]. However, these findings must be extended to support the integration of CAE diagrams. Doubts also remain about the syntax used in Figures 8 and 9. We are aware that the proliferation of hypertext links can lead to a complex tangle, which frustrates navigation and interpretation by interface designers and regulatory authorities. Similarly, more work needs to be conducted to determine whether it is appropriate to constrain the semantics of the links between CAE and QOC diagrams. Our initial development of this technique has exploited informal guidelines about the precise nature of these connections. However, it is likely that these guidelines may have to be codified if the approach is to be used by teams of accident investigators and systems designers. We have gone at least part of the way towards resolving these problems through the development of tool support [19].
ACKNOWLEDGEMENTS
Thanks are due to the South West Thames Regional Health Authority. Their openness has greatly helped efforts to improve accident reporting. I would also like to acknowledge the support of the Glasgow Accident Analysis Group and Glasgow Interactive Systems Group. This work is supported by EPSRC grants GR/L27800 and GR/K55042.
REFERENCES
[1] L. Love and C.W. Johnson, AFTs: Accident Fault Trees. In H. Thimbleby, B. O'Conaill and P. Thomas (eds), People and Computers XII: Proceedings of HCI'97, 245-262, Springer Verlag, Berlin, 1997.
[2] D. Norman, The 'Problem' With Automation : Inappropriate Feedback And Interaction Not Over-automation. In D.E. Broadbent and J. Reason and A. Baddeley (eds.), Human Factors In Hazardous Situations, 137-145, Clarendon Press, Oxford, United Kingdom, 1990.
[3] J. Reason, Human Error, Cambridge University Press, Cambridge, United Kingdom, 1990.
[4] T.P. Moran and J.M. Carroll (eds.), Design Rationale Concepts, Techniques And Use, Lawrence Erlbaum, Hillsdale, New Jersey, United States of America, 1995.
[5] C.C. Lebow, L.P. Sarsfield, W.L. Stanley, E. Ettedgui and G. Henning, Safety in the Skies: Personnel and Parties in NTSB Accident Investigations. Rand Institute, Santa Monica, USA, 1999.
[6] P. Beynon-Davies, Human Error and Information Systems Failure: The Case of the London Ambulance Service Computer-Aided Dispatch System Project. Interacting with Computers, (11)6:699-720, 1999.
[7] D. McKenzie, Computer-Related Accidental Death: An Empirical Exploration, Science and Public Policy, (21)4:233-248, 1994.
[8] Thames Regional Health Authority, Report of the Inquiry into The London Ambulance Service, The Communications Directorate, South West Thames Regional Health Authority. ISBN No: 0 905133 706, February 1993.
[9] A. Finkelstein and J. Dowell, A Comedy of Errors: the London Ambulance Service case study. In Proc. 8th International Workshop on Software Specification & Design, IWSSD-8, (IEEE CS Press), 1996, 2-4.
[10] C.W. Johnson, Proving Properties of Accidents, Reliability Engineering and Systems Safety, (67)2:175-191, 2000.
[11] US Department of Energy, Root cause analysis guidance document. DOE-NE-STD-1004-92. Office of Nuclear Energy, Washington DC, 1992.
[12] C.W. Johnson, A First Step Towards the Integration of Accident Reports and Constructive Design Documents. In M. Felici, K. Kanoun and A. Pasquini (eds.), Computer Safety, Reliability and Security: Proceedings of 18th International Conference SAFECOMP'99, 286-296, Springer Verlag, Berlin, 1999.
[13] C.W. Johnson, Proof, Politics and Bias in Accident Reports. In C.M. Holloway (ed.), Proceedings of the Fourth NASA Langley Formal Methods Workshop. NASA Technical Report Lfm-97, 1997.
[14] H C Purchase, R F Cohen and M James, An Experimental Study of the Basis for Graph Drawing Algorithms. ACM Journal of Experimental Algorithmics, 2, (4), 1997.
[15] P. Ladkin, T. Gerdsmeier and K. Loer, Analysing the Cali Accident With Why?...Because Graphs. In C.W. Johnson and N. Leveson (eds), Proceedings of Human Error and Systems Development, Glasgow Accident Analysis Group, Technical Report GAAG-TR-97-2, Glasgow, 1997.
[16] G. Cockton, S. Clark, P. Gray and C. W. Johnson, Literate Design. In D.J. Benyon and P. Palanque (eds.), Critical Issues in User System Engineering (CRUISE), 227-248. Springer Verlag, London, 1996.
[17] S. Buckingham Shum, Analysing The Usability Of A Design Rationale Notation. In T.P. Moran and J.M. Carroll (eds.), Design Rationale Concepts, Techniques And Use, Lawrence Erlbaum, Hillsdale, New Jersey, United States of America, 1995.
[18] C.W. Johnson, Literate Specification, The Software Engineering Journal (11)4:225-237, 1996.
[19] C.W. Johnson, The Epistemics of Accidents, Journal of Human-Computer Systems, (47)659-688, 1997.
[20] F.V. Jensen, Bayesian Networks, UCL Press, London, 1996.