Evaluation
This page provides information about the evaluation and metrics for the TREC-IS 2018 track.
Ground Truth
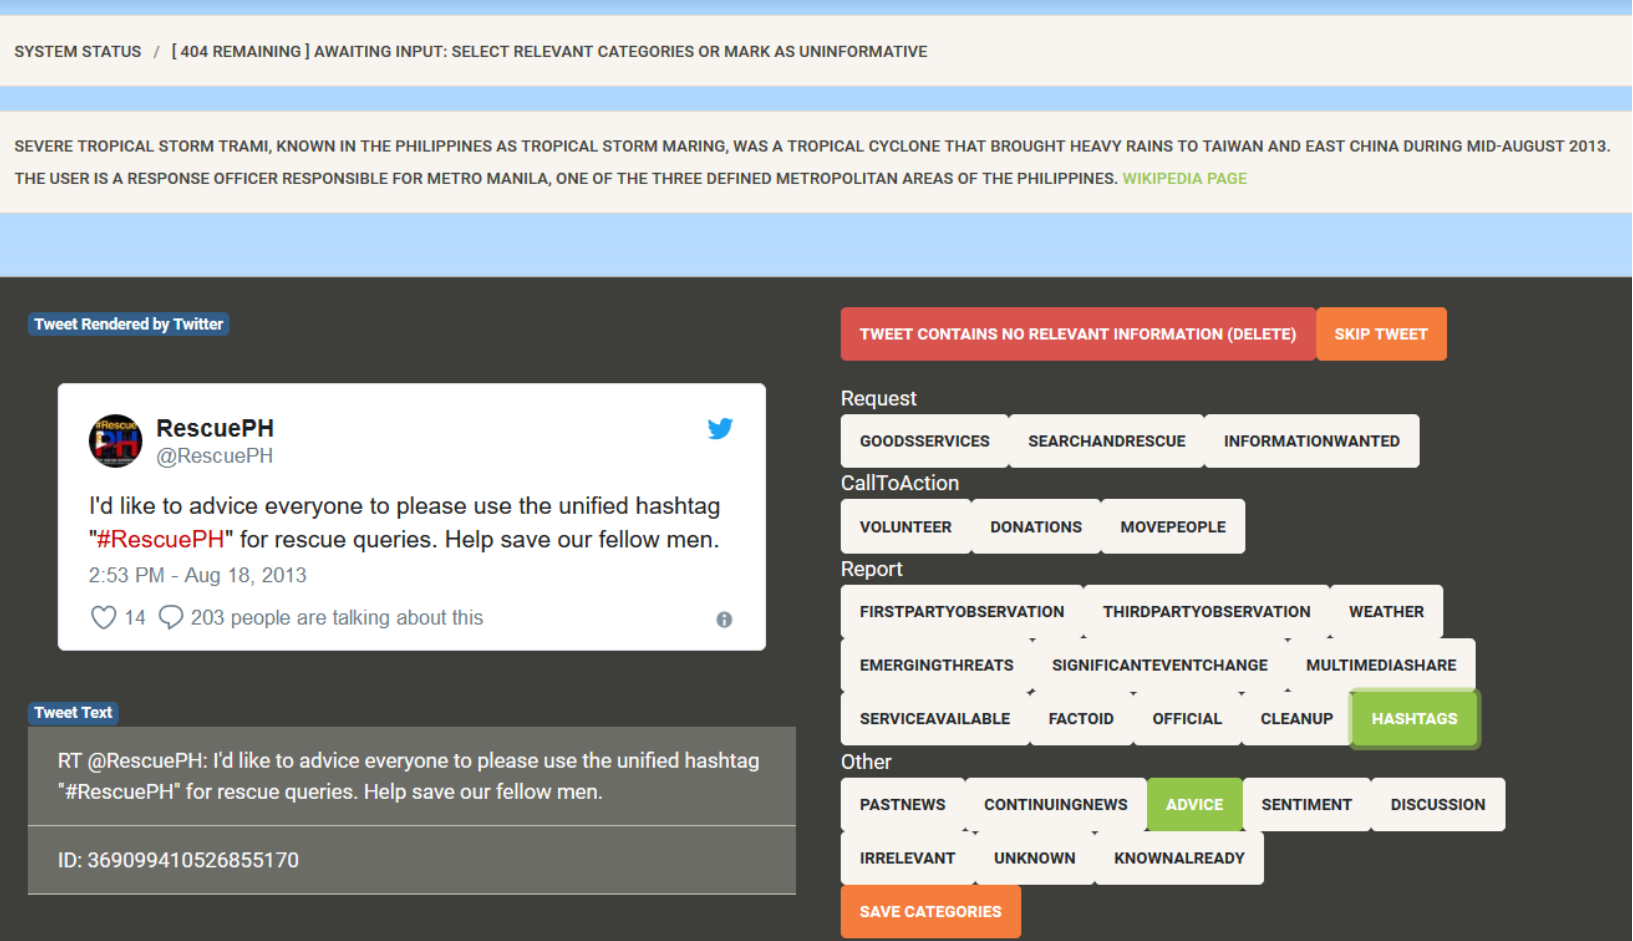
Human Labeling
To evaluate the performance of the TREC-IS systems, we had human assessors manually label all of the tweets within the 2018 Test Dataset. This is around 20,000 tweets. The assessors assigned one or more high-level information types to each of the tweets. The assessors also assigned an information priority level to each tweet, indicating how important it is that a response officer sees that tweet. The priority levels are: low, medium, high and critical.
For labeling, a single expert TREC assessor was used per tweet.
Metrics
Information Type Categorization
The first way that we want to evaluate the quality of a TREC-IS system is how effectively it can categorize the tweets into the 25 high-level information types in the TREC-IS Ontology. Notably, participant systems for 2018 were tasked with assigning one information type per-tweet (the most representative one). However, when creating the ground truth, the human assessors were allowed to select as many information types as were appropriate. For this reason, we evaluate information type categorization in two ways, referred to as multi-type and any-type.
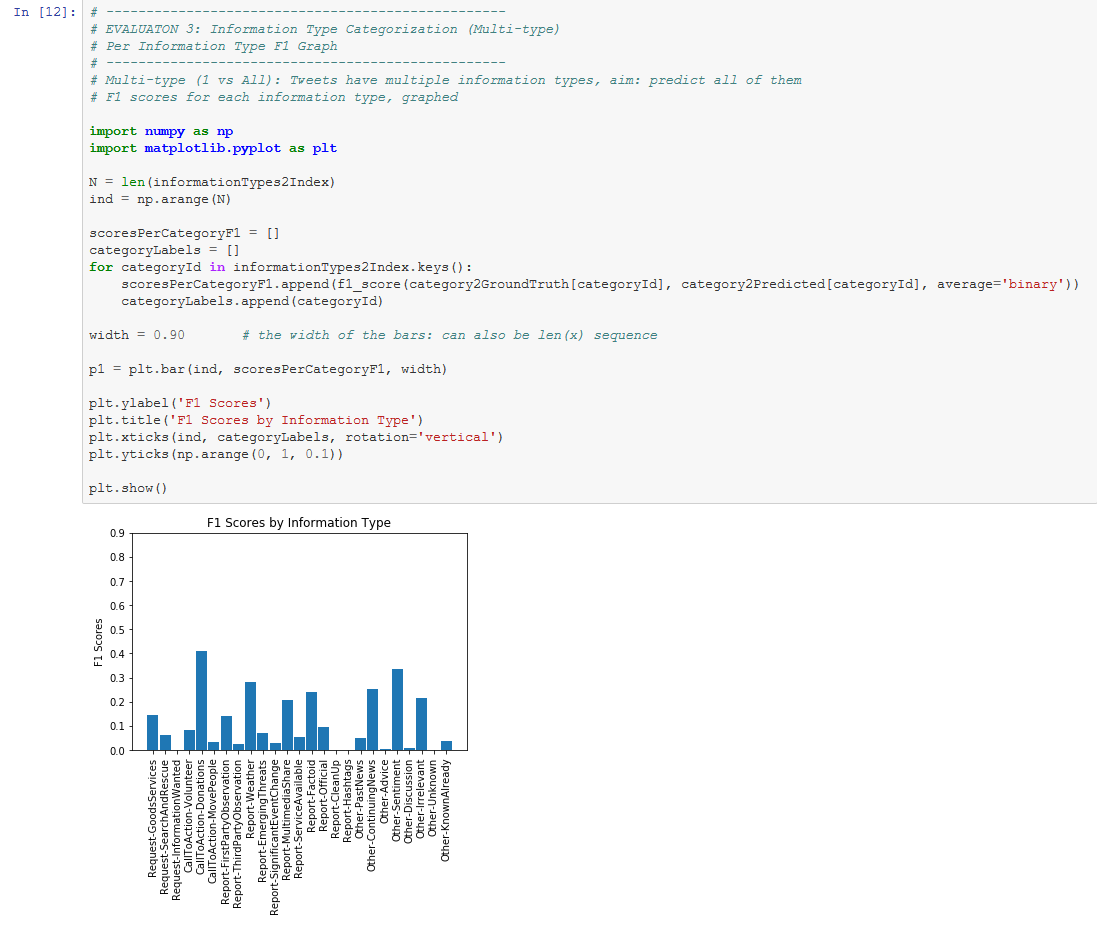
Multi-Type: Under the multi-type evaluation, we calculate categorization performance per information type in a 1 vs All manner. A system is considered to have categorized a tweet for a category correctly if both the system and human assessor selected that category. Note however that since a system can only select one category per tweet but the assessors can select multiple categories per tweet, system performance across topics cannot be perfect under this metric. For instance, if a tweet had three categories assigned to it, then a system can only receive a maximum of a 1/3 score for that tweet. Multi-type evaluation is primarily useful for contrasting performance between information types or between events.
Any-Type: In contrast, under the any-type evaluation, a system receives a full score for a tweet if it assigned any of the categories that the human assessor selected for that tweet. This is useful for providing a view on the overall performance of a TREC-IS system.
Multi-Type Metrics
Precision (Positive Class): Precision when identifying each information type category alone or averaged across all information types under 1 vs. All.
Recall (Positive Class): Recall when identifying each information type category alone or averaged across all information types under 1 vs. All.
F1 (Positive Class): Harmonic mean of Precision (Positive Class) and Recall (Positive Class).
Accuracy (Overall): Overall categorization accuracy. Note that unlike the above metrics this accounts for when system correctly does not assign the target class (true negatives), and so will be much higher.
Any-Type Metrics
Precision: Raw categorization precision over all tweets (micro averaged).
Recall: Raw categorization recall over all tweets (micro averaged).
F1: Harmonic mean of Precision and Recall (Target Metric).
Accuracy: Raw categorization accuracy over all tweets (micro averaged).
Information Priority
The second aspect of a TREC-IS system that we want to evaluate is to what extent can it identify key information that the emergency response officer needs to see. This is operationalized by comparing the information priority score provided by each system and the priority label provided by the human assessor per tweet.
To enable such a comparison two transformations were first performed. First, the four information priority labels used by the human assessors were mapped into numerical scores as per the guidelines. In this case, low=0.25, medium=0.5, high=0.75 and critical=1.0. Second, as some participant systems did not provide scores within a 0-1 range, all system scores were subject to a max-min normalization, with a minimum score cap of 0.25.
Information Priority Metrics
Mean Squared Error: Error between the human assigned score and the normalized system priority score.
Evaluation Notebook and Results
Jupyter Notebook
For the 2018 edition, we are trialling evaluation via Jupyter Notebooks. In this case, we provide a standard Jupyter Notebook that will provide multiple evaluation outputs for a given participant run. This notebook takes as input: 1) a participant run, 2) ground truth label files, 3) the ontology category files.
Run Results
Participants to the track are provided with the following for each of their runs:
Original Notebook: This is the .ipynb file that will enable the reproduction of the evaluation performed by the organizers. (TREC-IS_2018_Evaluation_Notebook.ipynb)
Notebook Print: This is a exported copy of the notebook contents and computed cells when running that notebook as an HTML file. (TREC-IS_2018_Evaluation_Notebook.html)
Text File Results: This is a basic text print of the results calculated by the notebook. The text results are split over three individual files. [run].results.overall provides averaged performances over the information types under Multi-type, Any-type and Priority evaluation. [run].results.pertopic provides a per-information type performance breakdown under Multi-type evaluation. Finally, [run].results.perevent provides a per-event performance breakdown under Multi-type evaluation.
Track Median Results: This file contains the median performance across participants to the 2018 edition of the track in terms of the averaged performances over the information types under Multi-type, Any-type and Priority evaluation. Participants should use these numbers to evaluate how overall well they performed in comparison to the field.
Supported By