Contents
olymppred.m
From A First Course in Machine Learning, Chapter 1. Simon Rogers, 31/10/11 [simon.rogers@glasgow.ac.uk]
clear all;close all;
Load Olympic data and fit linear model (see fitolympic.m)
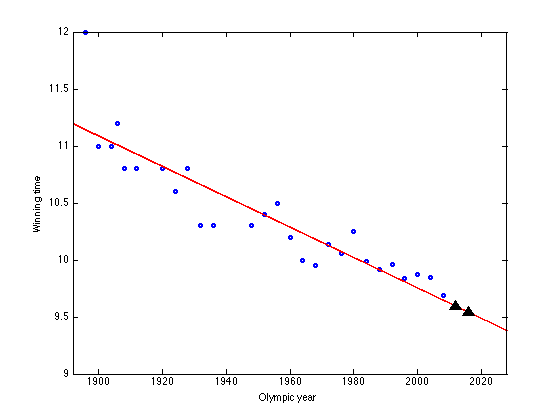
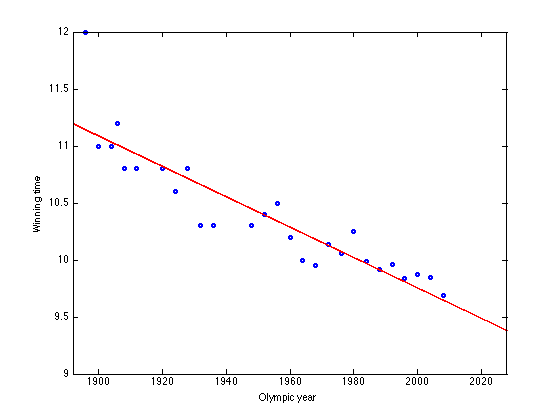
load ../data/olympics
x = male100(:,1); % Olympic years
t = male100(:,2); % Winning times
N = length(x); % 27
m_x = sum(x)/N;
m_t = sum(t)/N;
m_xt = sum(t.*x)/N;
m_xx = sum(x.*x)/N;
w_1 = (m_xt - m_x*m_t)/(m_xx - m_x^2);
w_0 = m_t - w_1*m_x;
figure(1);hold off
plot(x,t,'bo','markersize',5,'linewidth',2)
xplot = [min(x)-4 max(x)+20];
xlim(xplot);
hold on
plot(xplot,w_0+w_1*xplot,'r','linewidth',2)
xlabel('Olympic year');
ylabel('Winning time');
Make predictions at 2012 and 2016
xpred = [2012 2016]; % Add more values to this vector for more predictions
tpred = w_0 + w_1*xpred;
Display the predictions
for i = 1:length(xpred)
    fprintf('\n Predicted winning time in %g is: %g seconds',xpred(i),tpred(i));
end
 Predicted winning time in 2012 is: 9.59471 seconds
 Predicted winning time in 2016 is: 9.54139 seconds
Add predictions to the plot
plot(xpred,tpred,'k^','markersize',10,'markerfacecolor','k');