Contents
pcaexample.m
From A First Course in Machine Learning, Chapter 6. Simon Rogers, 01/11/11 [simon.rogers@glasgow.ac.uk] PCA example
clear all;close all;
Generate the data
Y = [randn(20,2);randn(20,2)+5;randn(20,2)-5];
% Add 5 random dimensions
N = size(Y,1);
Y = [Y randn(N,5)];
% labels - just used for plotting
t = [repmat(1,20,1);repmat(2,20,1);repmat(3,20,1)];
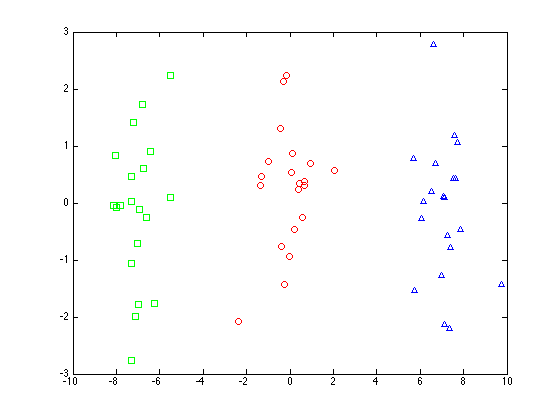
Plot the original data
symbs = {'ro','gs','b^'};
figure(1);hold off
for k = 1:3
    pos = find(t==k);
    plot(Y(pos,1),Y(pos,2),symbs{k});
    hold on
end
Do the PCA
Subtract the means
Y = Y - repmat(mean(Y,1),N,1);
% Compute covariance matrix
C = (1/N)*Y'*Y;
% Find the eigen-vectors/values
% columns of w correspond to the projection directions
[w,lam] = eig(C);
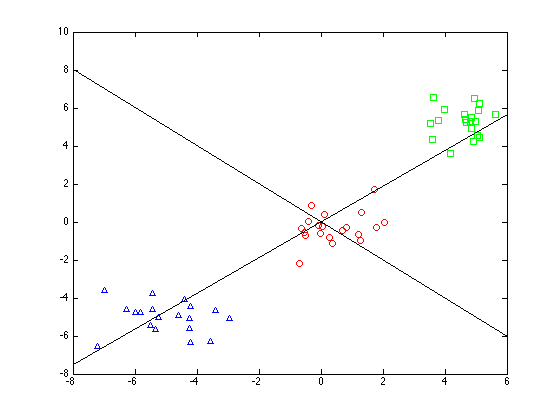
Plot the first two components on to the original data
figure(1);hold off
for k = 1:3
    pos = find(t==k);
    plot(Y(pos,1),Y(pos,2),symbs{k});
    hold on
end

xl = xlim;
for k = 1:2
    plot(xl,xl*w(1,k)/w(2,k),'k');
end
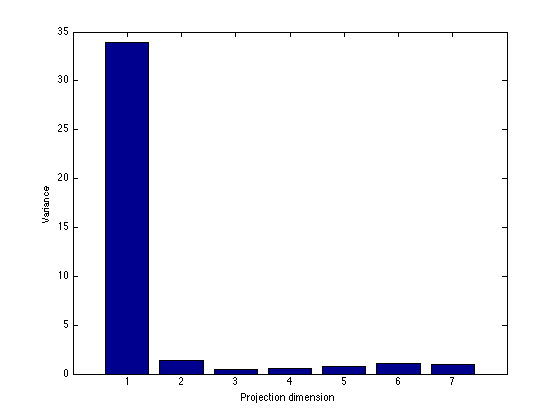
Bar plot of the eigenvalues
figure(1);
hold off
bar(diag(lam));
xlabel('Projection dimension');
ylabel('Variance');
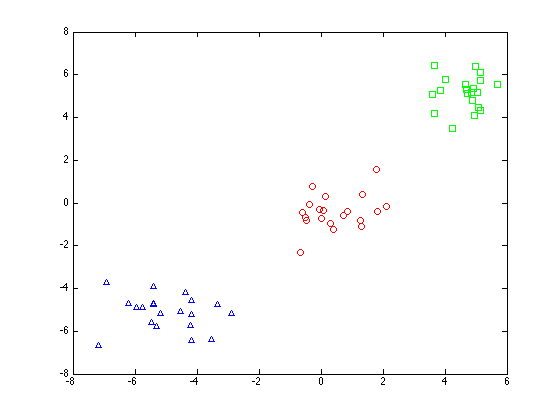
Plot the data projected into the first two dimensions
X = Y*w(:,1:2);
figure(1);hold off
for k = 1:3
    pos = find(t==k);
    plot(X(pos,1),X(pos,2),symbs{k});
    hold on
end