Data from the Social Gravity trials
The Social Gravity system is described inVideo
A video is available: SocialGravity-final.mp4 (high quality, MP4, subtitled), or an abbreviated version can be seen on YouTube:Data
During the experiment a large quantity of data was captured. This is made available here for other researchers. This data includes all GPS position data, high-resolution inertial sensing logs throughout the trial, attributes of GPS fix and network dropouts. Slow changing characterestics (such as GPS position) are recorded at 4Hz, and inertial sensing data is recorded at 100Hz throughout the trial. This includes accelerometer, magnetometer, and gyroscope measurements. The Python scripts used to analyse and plot the data are also provided, although researchers should be aware that these scripts are mainly undocumented and rather untidy!Experimental procedure
The experimental procedure from the paper is reproduced below:Experiment Structure
Five separate one-hour trials were performed to help understand these questions. 25 participants aged from 18 to 65 were recruited for the trials, in 5 groups of 5 people. 15 participants were male, 10 female; 6 students and 19 members of university staff. None of the participants worked in areas directly related to HCI.Hardware
The prototype system was constructed using standard Nokia N95 phones, in conjunction with the SHAKE inertial sensor pack. This Bluetooth sensor pack provides accelerometer and magnetometer readings and includes a pager-style vibration motor for vibrotactile feedback. The N95 has builtin GPS for positioning, and its 3G connectivity is used for communications. For our prototype the SHAKE device was encased in a mobile phone shaped form factor. The N95 was attached to a lanyard worn around the neck and was connected to the sensor pack by Bluetooth. The phone simply provided a 3G connection to the remote Social Gravity server.Tasks
Participants completed two primary tasks during the study:Rendezvous: From an initial starting position, use the device to scan for the location of the meeting point, then attempt to find this, using their own judgement at any path choices until meeting up with other participants.
Free walking: Repeat the task, but this time use their own choice of route to the same meeting point, with no feedback to guide them. Completing this second task allowed us to compare between participants’ normal behaviour and that when using the system.
Procedure
At the start of each session each participant was met by a researcher and introduced to the system and its purpose. Each participant’s meeting location was separate to minimise effects from participants recognising each other before meeting up. Participants then used the system for a short training session, lasting no more than five minutes, in which they were able to feel example feedback and use the system while moving. Each participant was then taken to a location at the edge of the university campus. The five starting points were the same for each session, and were spaced evenly at the edges of an area of approximately 0.5km^2. When all participants were ready, each began the task while the researcher observed their behaviour from a short distance behind them. When all participants met up they were led back to their starting points and asked to make their way to the rendezvous point a second time, this time using their own choice of route rather than using the feedback to guide them. This provides a baseline measure of the best possible perfomance where users know exactly where to go and do not need to interact with the system. Finally, when all participants met up for the second time a short interview was conducted. At the end of the study each participant was rewarded with a bookstore gift voucher as a token of our appreciation.Trial format
Each trial had 5 participants and two stages ("rendezvous" and "free walking"). In the first stage, the rendezvous task was performed, in the second stage, the participants were returned to their starting location and had to walk back (without using the guidance system) to the meetup point from the first stage. There were 5 trials, for a total of 25 particpants. The trials took around 14 minutes on average for the rendezvous condition, and around 8 minutes on average for the free walking condition. The data here represents around 10 hours of recordings (25 minutes per participant).All of the experiments were carried out on the Swansea University campus.
Trial summary
An Excel spreadsheet summarising the trials is available here. This includes the times for each trial, the rough distances walked (computed from GPS positions), and the pedometer estimate of steps taken, for both the rendezvous condition and the free walking condition (called "Second Run" in the spreadsheet). These results are also available as a PDF. The pedometer and GPS distances here should not be relied upon for precision; they are rough estimates and do not account for step length variation and use imprecise methods for summing GPS distances.The structure of the data is given below. The specific format of each file is given in the links. Note that the log files are intended to be parsed with Python; they are simply string representations of dictionaries and can be trivially parsed in Python.
- For each experiment i:
- For the each particpant j (j=1,2,3,4,5) and stage k (k = rendezvous, or freewalking):
- KML file, giving GPS locations of each participant (for use with Google Earth). Named trial-i-k_phone-j.kml
- Client log file, giving summary data logged at 1Hz. Named trial-i-k_phone-j.log
- Inertial sensor file, giving inertial sensing traces at 100Hz (accelerometer, gyroscope and magnetometer). Named trial-i-k_phone-j.txt
- For the rendezvous condition only:
- KML file, giving GPS locations of all five participants. Named trial-i-server.kml.
- Server log file, giving the server's view of the trial, logged at 1Hz. Named trial-i-server.log.
- For the each particpant j (j=1,2,3,4,5) and stage k (k = rendezvous, or freewalking):
Download
The data is 513Mb uncompressed. It is available for download as a zip file: SocialGravity-Data.zip (76 Mb).Online viewing
The data for each trial can be viewed online, including summary graphs and map plots. The trials can be watched online using the Google Earth plugin. These can be viewed with the map viewer tool. Note that in these maps, the "Own path" condition corresponds to the "free walking" condition (i.e. without guidance). The server path shows all five participants, while the individually numbered paths show the paths for that specific participant. The colored paths are the paths of the participants; the black path is the position of the centroid.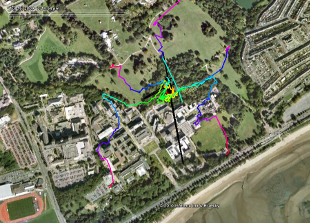
Other plots
There are numerous summary plots of the whole trial data in the graphs page. Individual trial data summary plots are given in the following pages:Analysis scripts
Simulator
The simulator of rendezvous behaviour described in the paper is available for download. It is a Python script and should run on most platforms.
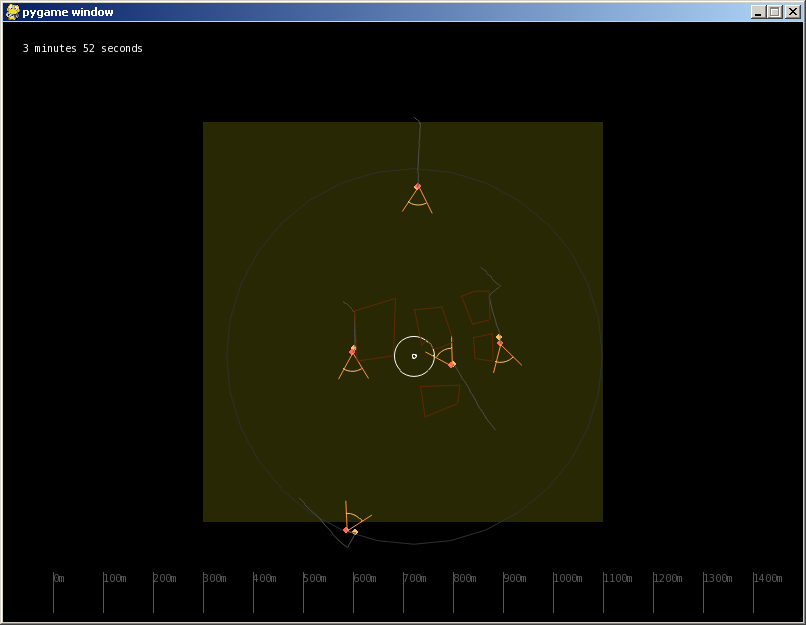
The simulator running in interactive mode.